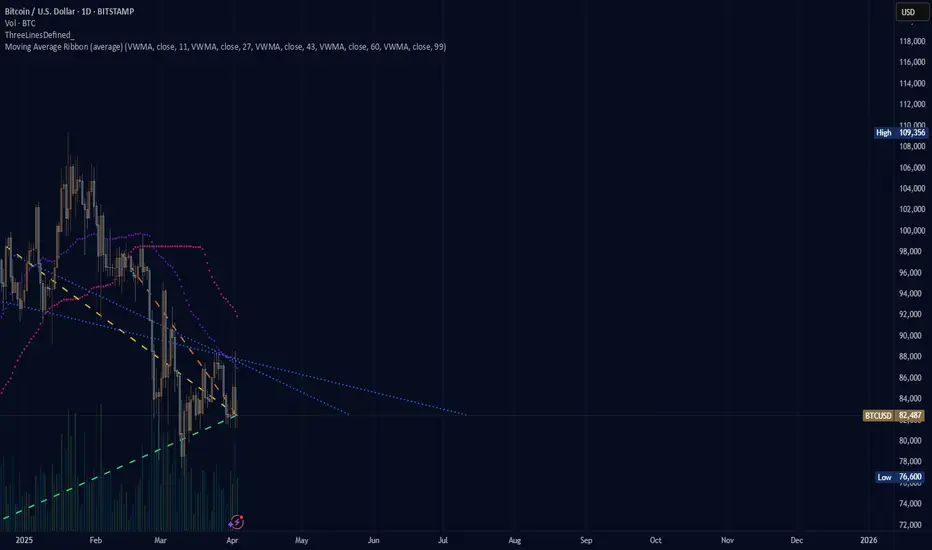
(BTC) bitcoin "the case for bitcoin"Where is bitcoin going to be during this 2025 year. The image shows a blank canvas. The drawing untold, unknown for now? Where will the price move and how long will it take to move through the pattern, bearish? bullish? neutral? fire? ice? greener pastures? The graph showing what is being seen tends to see a rise in price once the price moves past the crossing of the blue lines but the purple and pink dotted lines are facing down with no indication that the price is moving neutrally in a recovery effort.
2025
(ETH) ethereum "update"Ethereum update. Nothing per se to analyze. More of an image to share with two indicators. Not much else to say here. It would be better if the average lines (pink and purple) had dots closer together. The further those dots become on a descent, the higher the likelihood there is of a big drop in price. We want the purple line to begin to curve in a reversal pattern for the price to recover from what is losing right now. Huge discount on Etheruem though, if you like that sort of thing, and Ethereum.

K.I.S.S => ETHHello TradingView Family / Fellow Traders. This is Richard, also known as theSignalyst.
📉 ETH Market Update – Keeping It Simple 📉
Since breaking below its last major low in December 2024, Ethereum (ETH) has been stuck in a bearish trend.
But don’t lose hope, bulls! 🐂
For the long-awaited altseason to kick off, ETH needs to flip the script and break above its last major high — currently sitting at $2,100.📈
Until then, patience is key. 🧘♂️
📚 Always follow your trading plan regarding entry, risk management, and trade management.
Good luck!
All Strategies Are Good; If Managed Properly!
~Rich

Speculating Bitcoin's Cycle Top!Hello TradingView Family / Fellow Traders. This is Richard, also known as theSignalyst.
📚 Back to basics.
🗓️ This is the BTC monthly log chart.
📊 By applying two simple channels—one short-term (🔴) and one long-term (🔵)—we see both upper bounds aligning right around the 💰 $300,000 mark. A classic case of confluence at a key psychological level 🧠✨
👇 What do you think—are we headed there this cycle, or is it just hopium? Drop your thoughts in the comments!
📚 Always follow your trading plan regarding entry, risk management, and trade management.
Good luck!
All Strategies Are Good; If Managed Properly!
~Rich

Trading Minest. Welcome to the most difficult game in the worldUnfortunately, you will be playing against some of the sharpest, fastest, smartest, most intelligent, well-informed, irrational, and, in many cases, unethical intellects in the world.
You are fighting a computer that reacts faster than you.
A trader who has more experience than you.
A fund that has more money than you.
An insider who has more information than you.
Others who misinform you.
An inner voice that will do everything it can to stop you.
So, give up your dreams of making a quick and easy buck.
Your first goal is survival.
Your first absolute goal is to learn how to stay in the game.
You can only do this by marking your territory.
By understanding how the competition thinks and acts.
By having a clear game plan.
And by choosing your attacks very, very carefully.
I've been sharing my knowledge on TradingView for years, but I'm sure this post will help you, too.
I want to talk about Trading Minest. After I set up a trading firm, I realized that this is the knowledge that most traders lack.
1. Survive at all costs
The higher your survival rate, the better trader you'll be.
If you disagree with that, you better give your money to me.
You don't have a survival instinct.
A strong survival instinct is an essential personal quality you must possess.
It teaches you to jump out of losing deals and hold on to winning ones with a dead grip.
That's what your inner attitude should be. It's essential because trading is all about survival.
It's also the essence of our lives.
2. You must be constantly afraid
You have to evaluate the opponent. If he is a stone, be water; if he is water, I will be a stone.
Maximize objective assessment of your opponent and adapt to him, but most people lack enough fear.
And if we don't have fear, we can open any trade.
And we won't use stop losses.
We're gonna do everything wrong.
And lose.
I want you to be afraid.
Example: If you are not afraid to lose, and we have the same trade, who will choose the more defensive tactic?
Whoever thinks I'm not afraid of all this nonsense, I have plenty of money. With that attitude, you will lose.
But if I am scared to death, I will use stops, watch what is happening in the market, and calculate my actions. But if a person has no fear, he will act recklessly, and then all of a sudden, bam, bam, and disaster will happen.
Many traders have lost money and committed suicide because they had no fear.
3.The ability to win when things aren't going well for you
The most essential quality of an athlete is the ability to score points when they need to catch up.
You should be able to win when you fall behind or have four losing trades; that is the difference between good traders and bad traders.
You say to yourself, "I'm behind; I'm not doing well."
And you have a choice to throw up the white flag and give up.
Or you can say, "To hell with it. I'm just gonna grit my teeth and get back in the ring and give it my best."
That's what your inner attitude should be.
You have to be able to win when you're behind.
You have to learn how to win when you're in a losing position.
That's how you have to set yourself up.
Otherwise, you will be in big trouble because no one can avoid losses in market trading.
And at some point, you are guaranteed to have a losing trade.
Only optimists can trade.
You're all so damn optimistic.
Because you think you can win a game, many people believe it's impossible. Many people say how much they lost in the market, but if they failed, someone made millions of dollars every year waiting for me to take money from the dealing. You're donating money to people who don't know the basic rules.
4. Use only proven methods
Do what works and don't do what doesn't work.
Reinforce the strong.
Best Regards, EXCAVO
_____________________
Disclosure: I am part of Trade Nation's Influencer program and receive a monthly fee for using their TradingView charts in my analysis.

(DOGE) dogecoin "oversold indications"The price of Dogecoin is considered oversold based on an Elliott Wave custom pattern by DGT that I sometimes use to look for overbought and oversold signals. The four diamonds is similar to Jasmycoin's oversold signals.

(JASMY) jasmycoinDGT pattern indicator featuring elliott waves. Green diamond is major oversold, green triangles is minor oversold, same for peaks only circles and so on. I'm seeing a lot of oversold signals in cryptocurrency using this indicator, including Ethereum, the blockchain Jasmy is run on as a layer 2 token IoT company.

(jasmy) JASMY bar array pattern fading in and out of a low motion pattern indicator. Use examples from the past to understand the meaning. included lines from previous posts unchanged in purple representing key moments of the jasmy chart for reference. The price broke the previous lows.

(ETH) ethereum "nft land"I was recently looking into NFTs on Opensea and while doing so I noticed there are far more NFTs from people based on the Ethereum blockchain compared to the other offerings on Opensea. Even though Solana (SOL) is on the forefront of popularity with Meme projects Opensea does not offer an exclusive Solana chain to provide NFT ideas. Hence, there is not an easy way to compare to amount of Solana projects to Ethereum projects being built, developed and/or offered. It would be interesting to see the comparison of NFTs on Solana versus Ethereum. Ethereum reduced their transactions with a transition to Proof-Of-Stake and since then the number of Ethereum NFTs must be growing. While the news is on a constant watch for new meme projects, tokens, the Opensea network for many other blockchains is not growing as nearly rapidly as Ethereum.

(MATIC) POLYGON "past ticker"Polygon was originally listed to Coinbase on 3/11/2021. Now what was MATIC goes by POL. POL was listed during September of 2024. For whatever reason it seems like Polygon (POL) has not seen as much attention as with when Polygon was (MATIC). Also, Solana (SOL) has been the main avenue of attention for the last couple of years outside of the mass appeal for NFTs on Ethereum's blockchain and Bitcoin payment system, savings adjusted reality.

BTC - Get Ready!🚨 CRYPTOCAP:BTC is dipping hard! 🚨
📉 Get ready for a massive entry at $72,000—here’s why:
It aligns with:
1️⃣ Lower bound of the blue wedge pattern
2️⃣ Previous resistance turned support
3️⃣ Key demand zone
4️⃣ -34% correction phase
📊 This level could be a game-changer! Are you buying?

(JASMY) jasmy {9 weeks of down for Jasmy} that certainly was not expected based on the previous performance.

(JASMY) JASMY "that sux"Jasmy losing like there is no tomorrow. The Elliott Wave prospects of Jasmy seem to have fallen through. The December price was what I wanted to believe was a peak of Elliott Wave patterns with two more to follow only slightly lower but this prolonged down angle on the chart is a bummer.

Chainlink $LINK Growth Factors in 2025
Chainlink is expected to experience significant growth due to several key factors influencing its adoption and market value by 2025:
1. Decentralized Oracle Network: Chainlink's role as an oracle network allows it to connect smart contracts to real-world data, enhancing the functionality and reliability of decentralized applications, particularly in decentralized finance (DeFi).
2. Strategic Partnerships:
Collaborations with firms like Ripple and Swift are establishing Chainlink as a critical player in traditional finance, emphasizing its importance for providing secure, real-time data for various financial applications.
3.Broader DeFi Implications:
The rising adoption of stablecoins, such as RLUSD, and the liquidity they provide are solid foundations for DeFi growth, which Chainlink supports through its reliable oracle services.
4. Technological Innovations:
Chainlink is advancing the Cross-Chain Interoperability Protocol (CCIP), aiding in seamless asset transfers across blockchains, making it more attractive for developers and enterprises alike.
5.Integration of Real-World Assets:
As asset tokenization grows, Chainlink's oracles will be pivotal in verifying data, reinforcing its utility in DeFi ecosystems and extending its reach into capital markets.
6. Overall Market Sentiment:
Predictions for LINK’s price in 2025 $60+, primarily driven by adoption rates and market dynamics, but optimistic scenarios could see much higher valuations.
Conclusion
In summary, Chainlink is strategically positioned for growth in 2025 through its innovations, partnerships, and persistent integration into both the DeFi space and traditional finance.
I see a standard pattern here of accumulation, pre-pump, pump, real pump.
There aren't many fundamentally strong infrastructure projects right now, but link is one of the strongest. That's why many people are adding it to their portfolios
Best regards EXCAVO

(DOGE) dogecoinfor dogecoin holders in the world to see a bit of pay per view imagery to make their mouth water. The colors, the picture, the imagery; ooh la la.

(XLM) stellarstellar headed towards the blackhole crossing. Will the price up and over or underneath is the question. Also shown in the graph is my standard parabolic look with varying colors for each side of the dots (bubbles).

(XLM) stellar "popular volume"The volume for XLM is trending up in recent weeks with major movement happening behind the scenes only visible through this indicator created to visualize the trend of volume.


BTC If the process of BTC continues to fall and based on what we've already seen with such heavy losses in layer 2 tokens the value of cryptocurrency will become a sludge of depressing outcomes. The indicator seems to reveal the changing phase with BTC in a falling pattern which could last for sometime even into the summer, sad.

Bitcoin's 2025 Price Action Mirrors 2017 - Is History Repeating?Bitcoin Halving & The Trump Factor: A Historical Parallel
Bitcoin's price action in 2025 is eerily reminiscent of the post-halving rally of 2017. In both cases, BTC saw a prolonged accumulation phase before a massive markup period. What's even more intriguing is how macro-political events align: Trump was elected in November 2016 , just before BTC went parabolic in 2017, and once again, he's elected in November 2024 , right before Bitcoin enters its explosive post-halving markup phase. Could this be more than just coincidence?
Accumulation Phase Ends – The Markup Begins
From November 9, 2024 , to February 28, 2025 , Bitcoin was in a 107-day accumulation phase . This mirrors previous post-halving cycles, where BTC consolidates in the Green HPR band before entering the next stage. Now, it appears we are entering the Markup Phase, where I expect Bitcoin to rally towards $120K+ in the coming months.
Applying the 2017 Cycle to 2025
The 2017 bull run followed a 59:156:360-day cycle (Accumulation → Markup → Distribution). Using the same ratio and expanding it for 2025, I’ve projected a 107:280:646-day cycle , where:
✅ 107 days Accumulation (Completed!)
📈 280 days Markup (Just Beginning!)
📉 646 days Distribution & Declining (Post-Top Phase)
This fractal projection aligns well with historical price action, reinforcing the likelihood of Bitcoin repeating this structure.
BitBo’s Rainbow Regression Chart Confirms the Setup
Looking at BitBo’s Bitcoin Rainbow Halving Price Regression Chart , BTC briefly dipped into the blue band , just like in 2017’s first wave. However, in both cases, Bitcoin quickly recovered within days and launched into its Markup phase , which is exactly what we’re seeing now!
🔹 Key Takeaway: Bitcoin is following its historic halving cycle patterns, and if history continues to rhyme, the next 280 days could be a wild ride to six-figure BTC prices! 🚀
Don't forget,
Patience is Paramount

LQR USDT #Spot #LQR #LongThis project has the potential to increase 50X to 100X
Don't forget money management.
Ready to move towards targets
0.13
0.22
0.30
0.5
0.7
1.5

Is Bitcoin Topping Out? Critical Levels to WatchSince the low of $15,476 on November 21, 2022, Bitcoin has surged to an all-time high of $109,588 on January 20, 2025. That’s an incredible +608% increase over 791 days. We also hit the long-anticipated $100K mark. But for almost three months now, Bitcoin has been stuck in a range between $90K and the all-time high, showing some indecision in the market.
Looking Back: Market Structure & Trends
Bitcoin spent over 250 days consolidating between $50K and $70K before finally breaking out in November 2024, right around the U.S. election. That breakout triggered a massive rally, pushing Bitcoin to 100K in just one month. Since then, bulls and bears have been battling it out, trying to establish control over this crucial psychological level.
A look at the pitchfork tool shows that Bitcoin has been rejected at the 0.618, 0.666, and 0.786 levels multiple times while trying to push higher. Recently, we lost the median line of the pitchfork and dropped below 100K, suggesting bullish momentum is fading. The 233 SMA/EMA on the 4-hour TF as well as the 21 EMA/MA on the daily TF has also flipped into resistance, adding to the bearish pressure.
Is February Shaping Up to Be a Bearish Month?
If we compare the current cycle to the 2020 bull market, the price action looks similar, forming a top where Bitcoin struggles to break higher. February could bring a healthy correction before any new leg up.
Key Support Zones & Confluences
Here’s where we could see solid support:
Unfilled CME Gap at $77,930 – Historically, Bitcoin tends to fill these gaps over time
Pitchfork Lower Support Line (~$80K) – If Bitcoin drops, this level aligns with multiple confluences by late February or early March
Fib Speed Fan (0.618 from $50K to ATH) – Perfectly lines up with the pitchfork lower support around $80K
Trend-Based Fibonacci Extension (1.618) – Another confluence at the $79K mark
Fib Retracement (0.5 from $50K to ATH) – Adds more support at $79.3K
Negative Fibonacci Retracement (-0.618) – Lands right at the open gap, reinforcing this zone
Daily 233 EMA/MA – Sitting at $81.3K and $76.4K, further supporting this region
Key Support Zone: $80K - $78K – With all these confluences, this is a strong area for a potential long setup
Additional Support Zone: FWB:88K - $86K – Another important region to watch for a bounce
Resistance Levels & Confluences
Psychological Resistance at 100K – A major battle zone between bulls and bears
Daily 21 EMA/MA (~$99.5K - 101K) – A key resistance level that could cap any upward movement
233 SMA/EMA on the 4H Timeframe – Now acting as resistance, adding pressure to the downside
Potential Trade Setups
Long Setup #1: A potential entry from FWB:88K - $86K
Long Setup #2: $80K - $78K support zone with confirmation could present a high-probability trade
Final Thoughts
Bitcoin is facing strong resistance at 100K, with multiple technical indicators suggesting a possible pullback. While the bigger trend remains bullish, February might bring a correction, providing great long opportunities around the FWB:88K - $86K and $80K - $78K region. Keep an eye on key support zones and look for confirmation signals before jumping into trades.
New Indicator Release
The 4H, Daily, and Weekly support zones seen on the charts are from my new indicator, which I released for free a few days ago. Feel free to check it out and incorporate it into your analysis.

RENDER (RNDR/USDT) - Potential Bottom & Breakout Incoming? RNDR is showing signs of a potential bottom formation on the daily chart.
