NZDCHF BATHarmonic Pattern Trading Strategy:
1. Combine patterns with 2-3 confirmations (e.g., MA, BB, RSI, Stoch) for increased accuracy.
2. Implement proper risk management.
3. Limit exposure to 3% of capital per trade.
4. Exercise caution: Not every Harmonic Pattern presents a good trading opportunity.
5. Conduct thorough diligence and analysis before trading.
Disciplined approach = Enhanced edge.
382 Fibonacci Retracement

ETH - Getting close to Major levels. COINBASE:ETHUSD is moving towards some major levels in time and price.
We have the equal time and price with the August 2022 high, April 2023 high giving us a potential high around the 17th of December.
There are double 1.27% Extension areas from those previous 2 highs around 2300.
The 382 from the ATH @ 2400 and if we break that then the 2600 level will be waiting with double 1.618% Extensions.
Once a top comes in the retracement will be key to the next move.
I will post smaller TF targets shortly.
An interesting run into the end of the year might set up the course for next year.
Enjoy the Week. 👍👍

LINKUSDT is testing the support right nowLINKUSDT is testing a key level at the $9.1 area, where the market has previously encountered resistance.
This level is important because it has acted as a significant point of resistance in the past, and traders will be closely watching the price action to see if the level is broken. If the price of LINKUSDT is able to break through this key level and establish new support, this could signal a potential bullish trend.
To apply Plancton's Rules in this scenario, traders should wait for the new liquidity and a new breakout to be confirmed before taking a long position. This means waiting for the price to break through the key resistance level and establish new support, which can provide more reliable signals for traders.
So, According to Plancton's strategy , we can set a nice order
–––––
Keep in mind.
🟣 Purple structure -> Monthly structure.
🔴 Red structure -> Weekly structure.
🔵 Blue structure -> Daily structure.
🟡 Yellow structure -> 4h structure.
⚫️ black structure -> <= 1h structure.
–––––
Follow the Shrimp 🦐

AUDUSD LONGFX:AUDUSD
Bullish movement on AUDUSD. Price broke above the Daily resistance and made a pullback to retest at the previous resistance now turned into support. Price even retraced to the 38.2% Fibonacci retracement. An engulfing candle on the lower timeframes (30min,15min) is confirmation to go long on AUDUSD

GBPUSD ShortFX:GBPUSD
A break and retest on GBPUSD, which breaks bullish structure. A bearish engulfing candle as a confirmation candle to go short on GBPUSD.

AUDUSD shortFX:AUDUSD
Break and retest on AUDUSD to go short, with the bearish engulfing candle as an entry confirmation.

NAS100 LONGCURRENCYCOM:US100
Nasdaq is moving bullish after breaking out of a resistance level and retesting on the same resistance it broke out, turning it into support. Price retraced at the 38.2% Fibonacci retracement level and a bullish engulfing candle to create a high confluence setup for a buy on Nasdaq.

GOLD - PB to Buy then more Downside. OANDA:XAUUSD also had a nice rally on friday. Now we look at how it reacts on Monday.
Ideal scenario would see us get a 382 retracement back to the 1643 area to then look for the equal leg ABCD towards 1680 and potentialy a move to the 61.8% 1733 and beyond.
But as we are in a down trend we need to be selling any ABCD Retracements.
Another one to watch early Monday. 👍👍

EURUSD - Move back above parity??FX:EURUSD had a nice reversal on friday and now looks to be headed above parity again before we see more selling come in again with a move that could take us to new lows again.
Monday I will be looking for a high to come in then look for the first retracement to Buy.
Ideal scenario would see us come back to 0.9800 around the 382 then rally from there.
A big week ahead. Enjoy!! 👍👍

LINKUSDT Head and Shoulders TopShort position @ peak of right shoulder from a bearish Head and Shoulders Top formation. TP1 38.2%; TP2 14.6% Fibonacci Retracement levels.

USDCAD- HIGHER PRICES!! FX:USDCAD on the longer time frame it looks as though we are heading a lot higher towards 1.3000 - 1.3300 areas.
1.3026 is the 382 from the 2020 high.
This is also the area where the ABCD will finish from October last year.
There is also the bigger ABCD from June last years low.
Once these patterns finish later in the year there could be another big sell off.
Things to watch going forward.
As it stands im looking for a pull back to get long.

AUDUSD LONGOANDA:AUDUSD
AUDUSD broke bearish structure, made a retest at a support
level. Anticipating a bullish move on AUDUSD for the entire
week.

BTC- Update.. One more Low??COINBASE:BTCUSD has the possibility of one more low.
The last low wasnt a massive volume spike so thats why im looking one more low to shake a few more out.
AB=CD completes at 12500 at around the 89% level from the ATH and the 2020 low..
Interesting couple of weeks ahead..

AAPL - 382 Gartley Coming in Monday!!NASDAQ:AAPL has had a 3 week rally into the 382 from the March high.
This rally has been weak with lower volume again on this last 6 day rally.
This is where time and price line up perfect.
If it gets above 152 then there could be a bigger move to the upside coming.
Being the biggest stock in the US Stock market then it has a bit of pull where things will go to next.
Interesting Monday ahead. Enjoy the week. 👍👍

AUDUSD shortOANDA:AUDUSD
AUDUSD broke structure and price is respecting at 38.2% Fibonacci retracement level with wick rejections for a short setup

AUDUSD SHORTOANDA:AUDUSD
AUDUSD broke out of the key level of support,made a retest at 38.2%, made a bearish engulfing candle These confluences give a good bearish setup

Weekly 38% Fibonacci Sell In The GBP/USDHere is a key level to watch in the GBP/USD as we roll into the final trading week of May:
Weekly 38% Fibonacci Retracement, 1.2592
Here's the trade:
1) Sell GBP/USD @ 1.2584
2) Stop Loss @ 1.2629
3) Profit Target @ 1.2546, 1:1 risk vs reward

BTCUSDT short updatedTriangle breakout on this H1 chart volume decreasing with Chaikin Money Flow falling below zero. 38.2% Fibonacci Retracement key level to watch for retest. Big show of weakness. Big selling pressure. 14.6% Fibo target maintained in confluence on this triangle pattern. 2nd target below on AB=CD pattern in confluence with local support as we can see in my last update today.

Weekly 38% Retracement In View For EUR/USD A key resistance level is in view for the EUR/USD:
Weekly 38% Fibonacci Retracement, 1.0920
Here's the trade:
1) Sell 1.0914
2) Stop Loss @ 1.0954
3) Profit target @ 1.0874, 1:1 risk vs reward

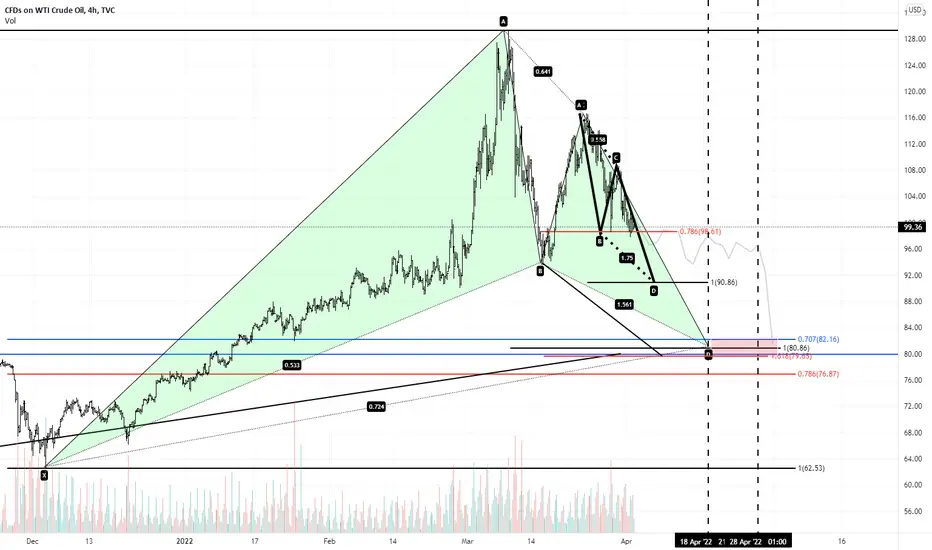
USOIL - Lower prices to come?Taking a look at the OIL this month we have a chance at getting back down to $80/Barrel or lower.
Firstly if we look at the AI for the month it looks to be choppy with a sell off later in the month. I have marked a couple of critical dates. Highs or lows into these dates could mean a reversal, for example if we are at a low coming into the 28th of April then I would expect a strong rally and vice versa a top into this time.
On the pattern side of things we are in an ABCD to the downside taking us to 90.86. This will be the first target if it can get back down below the 78.6% @ 98.54.
The bigger Gartley pattern has going down to the $80 area where we have multiple FIB levels. The main level being the 382 from the 2020 low, there is also the 1.618% extension @ 79.50 from the recent high/low.
ABCD Gartley comes down to 80.86.
This could be the start of the next move higher or the possibility of lower prices.
With all the news going on its better to stick to the patterns.
Enjoy the week. 👍👍🤑🤑
GBPUSD LongOANDA:GBPUSD
GBPUSD broke resistance/neckline yesterday on the reverse head and shoulder pattern.
Price pushed up and later retested at 38.2% with a bullish engulfing candle giving buy setup.

TQQQ retesting support Sept 2020 resistance, turned support being retested coincidentally on the 38% fib retrace. Looking for buy setups if they present themselves. Average investors have erased all gains since Sept 2020, if not actively managing accounts.

BTC 1H Bullish Divergence Can BTC Hold 38% Fib level and turn around?
The nearest target is 39369 (fib 50% level)
