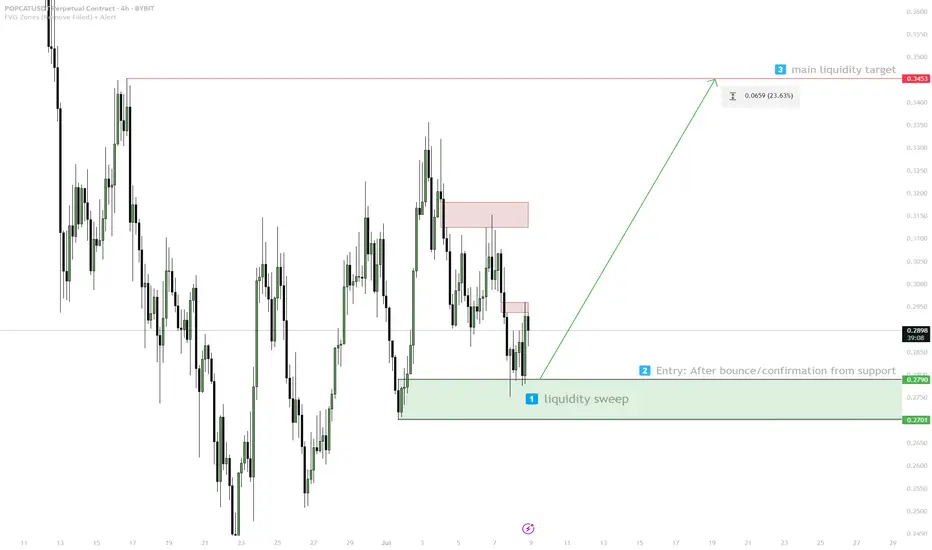
POPCAT — Liquidity Target Play1. Watch for sweep/liquidity grab in 0.270–0.279
2. Enter on confirmed bounce
3. Target: 0.3453 (liquidity zone)
4. Stop: below 0.270 — invalid
4h
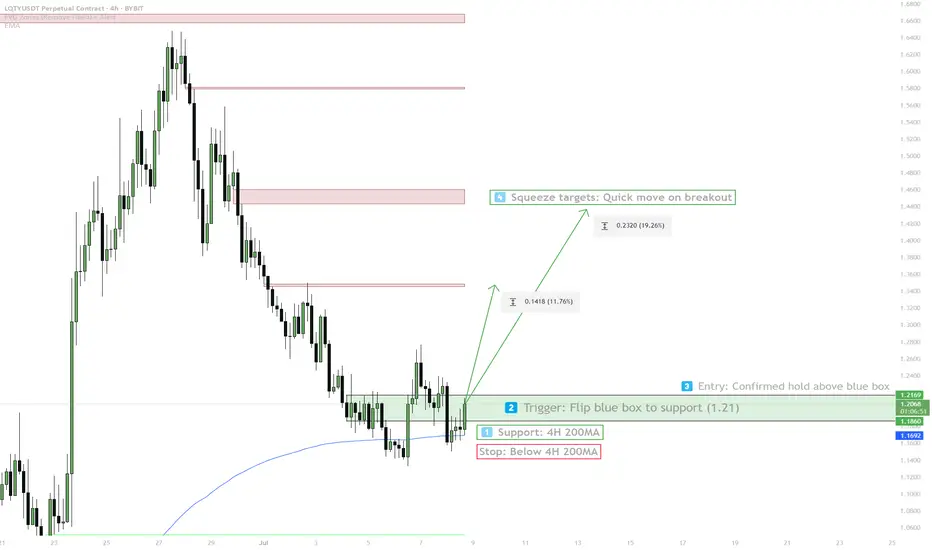
LQTY — 4H 200MA Hold & Squeeze Trigger1. Price holds above 4H 200MA
2. Flip blue box (1.21) to support for entry
3. Entry: Confirmed hold above blue box
4. Squeeze target: Quick move higher
5. Stop: Below 4H 200MA
ARB — 4H Supply Break & Trend Reversal1. Watch for confirmed trendline break
2. Retest & hold above 0.3275 for entry
3. TP1: 0.345–0.35 / TP2: 0.38 / TP3: 0.41
4. If fails, watch demand zones below

BTC — Major Resistance & Long TP Zone1. TP longs in red resistance zone (110k–111k)
2. Watch for rejection: possible short setup on bearish reaction
3. Key support at 105k — monitor for bounce
4. If price holds above red zone, scenario invalid — look for breakout

SOL — Liquidity Sweep & Demand Play1. Wait for price to sweep into demand
2. Enter long on SFP or strong bounce
3. Target: 240+
4. Stop: below demand zone
If no sweep, stay flat or wait for clear reclaim

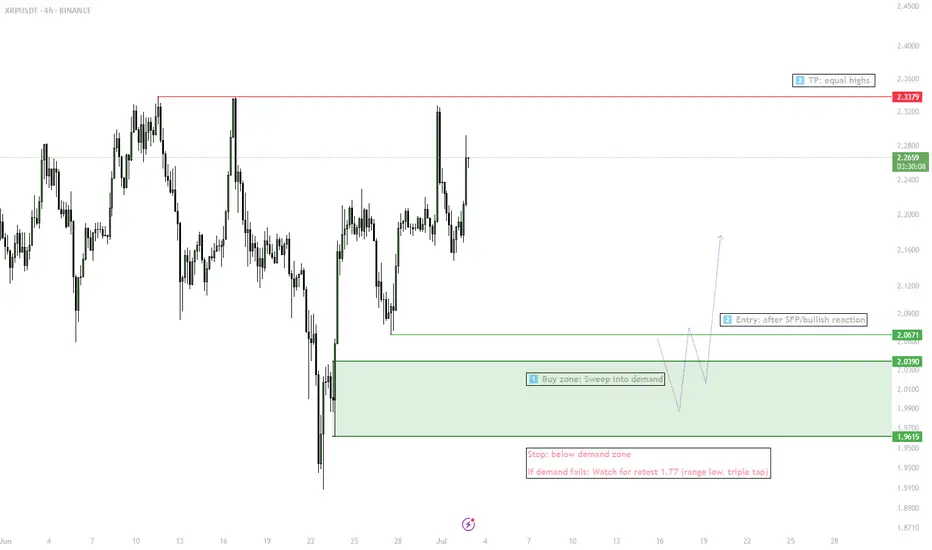
XRP — Liquidity Sweep & Range Play1. Wait for sweep into demand (2.07–1.95)
2. Enter long on SFP/bullish confirmation
3. Target: 2.33 (equal highs)
4. Stop: below demand zone
5. If stop triggered — next watch 1.77 for triple tap setup
GBPCAD 4H long setupGBPCAD 4H Spring 💡 | Smart Money Accumulation Before Expansion
Watching a textbook Wyckoff spring unfold here on the 4H.
After a multi-day rally, price retraced, and liquidity built up just above 1.8713. What happened next?
🔻 We got a liquidity sweep, tagging below 1.8687 — then a sharp rejection wick back into the range. That’s the spring.
🧠 Why this matters:
Liquidity below the range is now likely cleared.
Smart money triggered stops and may now flip positioning.
Buyer momentum reclaiming the broken zone signals strength returning.
🎯 My Play:
Long entry after reclaim above 1.8713
Stop below 1.8687 wick low
Targeting 1.8828 > 1.8830 as TP1
Extended TP at 1.8928 — aligning with prior supply zone
⚠️ Invalidation if we lose 1.8685 with momentum and no absorption.
This is not a chase trade — it’s a calculated entry after weak hands were shaken out. Let the market prove strength, then ride the reversion.
📈 If this spring holds, I expect continuation toward prior highs.

FARTCOIN — Perfect Swing Long Up 27%, Dips Are for BuyingDips into $1.06–1.09 (1H FVG + BOS) are for buying.
Still bullish while above $0.92–0.93 OB. Eyeing $1.43 next.

BTC — ATH or Lower High? Patience for the Next SwingBINANCE:BTCUSDT | 4h
Patience here — waiting for the next high-probability swing.
Major levels to watch: $111,990 (range high), $108,950 (weekly), $100,300–103,000 (demand).
Next move: ATH attempt or another lower high? Will act when the reaction sets up.

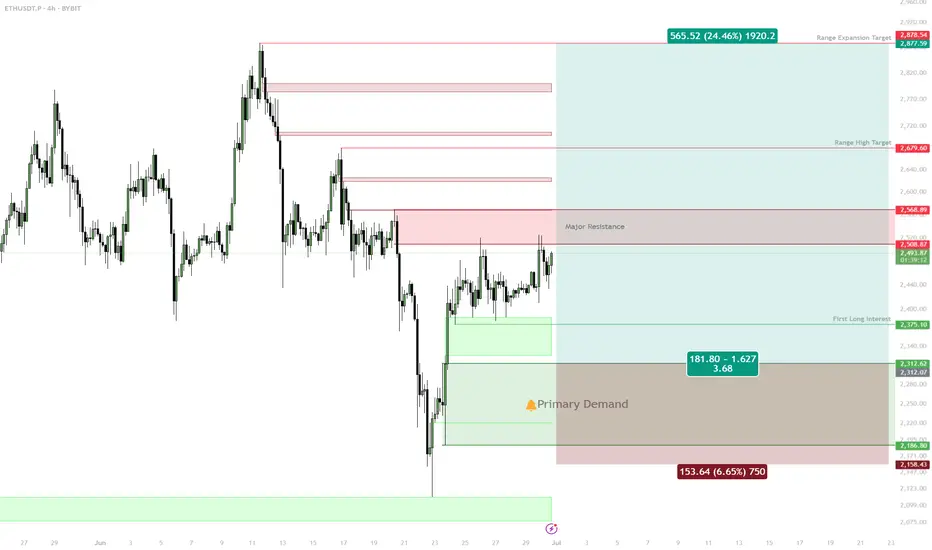
ETH: Deep Retrace or Shallow? Two Key Long Zones into Next Week✅ Two main long setups: Equal Lows @ $2,376, Untapped Demand $2,250–$2,314
✅ Best R/R from deeper demand zone, but will watch both levels
✅ Targets: $2,738 (range high), ~$3,000 (expansion)
✅ Shallow retrace may limit upside to a new local high, not full expansion
Setup 1:
Buy trigger on sweep and reclaim of $2,376 (equal lows)
Target: $2,508, then $2,738
Setup 2:
Preferred: Buy trigger into $2,250–$2,314 untapped demand
Target: $2,738, $3,000
Risk:
Wait for reaction/confirmation at both zones; no FOMO in between
🚨 Risk Warning:
If no strong bounce from these levels, stand aside — don't force the setup.
SPX6900 Bidding 4H S/R + FVG Zone — Looking for New Highs✅ 4H S/R + FVG provides strong support and bid opportunity
✅ 200EMA adds further confluence to the setup
✅ Invalidation = 1h closes/consolidates below $1.14
Active Setup:
Long Entry: In $1.08–$1.14 zone (confirmation: reclaim or bullish trigger in area)
Target: $1.72 (new highs/ATH)
Manual Invalidation: Cut if 1h candles close and consolidate below $1.14
🔔 Triggers & Confirmations:
Only bid on strong reaction or reversal in FVG/S/R zone
Exit if 1h PA settles below $1.14 (red pattern bars area)
🚨 Risk Warning:
Aggressive longs — keep risk tight, cut quickly if invalidated

ETH Eyes FVG Fill — Buy Dips Toward Confluence Support✅ Multiple confluences: 1h MSS, range lows, FVG, and OB cluster at $2,273–$2,319
✅ High probability of FVG ($2,529) being filled before new lows
⚠️ Downside sweeps are buys, not sells — use zone for bids
Active Setup:
Long Entry: Bids in $2,273–$2,319 zone (on confirmation: SFP/reclaim or strong bounce)
Targets: First TP at FVG ($2,529), next at range high ($2,787)
Stop: Below $2,185 (invalidate on close below sweep low)
🔔 Triggers & Confirmations:
Only enter on strong reversal/bounce in blue box
No FOMO above FVG, wait for clean setup
🚨 Risk Warning:
Avoid chasing into resistance (FVG), wait for dip entries with confirmation

BTC Flips Bullish Above $104k — 1D 50EMA & OB Cluster HoldCRYPTOCAP:BTC | #4h
Price reclaimed 1D 50EMA & $104k after a clean bounce from 1D FVG ($98k).
As long as $104k and the 4h OB cluster hold, lower targets are off the table.
Maintaining bullish bias toward $106k+.
Lose $104k? Bull plan is invalid, reassess for lower.

BTC H4 Range Play: Patience Until One Side Breaks✅ Price contracting within well-defined H4 range
✅ Clear lower highs and higher lows — coiled, ready to break either side
⚠️ FOMC incoming — possible volatility/surprise rate cut rumors
🎯 Trading Plan:
Short Setup:
If price spikes RH ($105,500) and H4 FVG (~$106,000), then re-accepts back inside the range
Entry on confirmation back below RH/FVG
Target: RL ($103,300) and $102,600
Stop: Above $106,300
Long Setup:
If RL ($103,300) or $102,600 gets swept then reclaimed (M15/H1 SFP or strong reclaim)
Entry on confirmation reclaim of RL/W
Target: RH ($105,500) and beyond
Stop: Below $102,200
🔔 Triggers & Confirmations:
Only enter trades on confirmed sweeps/reclaims or acceptance back inside after spike
No trade if price stays in chop between levels
📝 Order Placement & Management:
Sell Limit: $105,500–$106,000
🛡️ Stop: $106,300
🎯 Target: $103,300 / $102,600
Buy Limit (on sweep/reclaim): $102,600
🛡️ Stop: $102,200
🎯 Target: $105,500 / $106,000
🚨 Risk Warning:
Market coiled — can rinse either side
FOMC could be a catalyst; manage risk, don’t overtrade

BTC Setup: Watching for a Trap — Bids Below, Flip Above!Scenario 1 (Fakeout & Reversal):
Watch for push to $107,000–$108,000 (potential bull trap)
Close longs on move into resistance zone
Look for reversal signals (SFP, strong rejection) to re-enter lower
Scenario 2 (Sweep and Bounce):
Place bids at/just below $100,272 (1D Support) and within $98,000–$100,000 (FVG)
Target: Move back toward trendline resistance ($107k+)
Stop: Below $97,200
Invalidation:
Structure flips bearish on a clean break/close below $97,200
🔔 Triggers & Confirmations:
Enter longs only on SFP or strong bounce confirmation in FVG zone
Avoid chasing if price is between $102k–$106k (“no-trade chop”)
📝 Order Placement & Management:
🔼 Buy Limits: $100,300 / $99,000 / $98,000 (staggered bids in FVG)
🛡️ Long Stop: $97,200
🎯 Target: $107,000–$109,000 (trendline resistance)
📝 Take profits on spike to $107k+
🚨 Risk Warning:
Friday volatility, news risk
Avoid new longs above $107k — watch for failed breakout/fakeout

Nasdaq Bearish 4hNasdaq Bearish after the failure in continuation through Previous Weekly High and the rejection afterwards.
Setting the Target to 21,471.00 Swing Low and using 21,716.00 as Low Easy Hanging Fruit (LEHF) objective that We may even reach today despite the small range day expectation (pre-CPI)

BTC — Compression Into Downtrend Line, Key Demand Zone BelowPrice is compressing into a macro descending trendline, with recent strength off the $101.4k key demand zone. Structure shows potential for continued chop before a proper breakout or rejection decision is made.
🟩 Key Demand Zone: $101,300–101,800
• Previous strong reaction area
• Aggressive bids expected here again if retested
• Still valid while above — structure remains intact
📉 Trendline Resistance: ~$105.5k
• Critical compression point
• Watch for reaction here — breakout = bullish trigger
• Rejection = likely continuation of chop or lower retest
🔁 Playbook:
Rejection from trendline → range & chop → sweep demand
Clean breakout above = targeting $107k+
Deep flush back into $99–101k zone = buy opportunity
📌 Compression into major levels sets up explosive follow-through — either way, volatility incoming.

BTC - HTF confirmation pending...BINANCE:BTCUSDT
Sweeping H4/H12 range low — watching for SFP or strong bounce as a long trigger.
H4 structure broke bullish, flipped OB to breaker (unicorn overlap).
Long on sweep & SFP, target back to H4 MSB and range high.
Break below $104,400 — plan invalid, stay flat.
Wait for candle close, don’t front-run.

SPXUSDT bounce setup — Low Conviction Play Off Demand ZoneMEXC:SPXUSDT is testing a demand zone built from the H1 order block + H4 swing failure pattern (SFP). While the structure remains weak, the current zone offers bounce potential — but conviction is low.
Setup:
🟩 Demand Zone: $0.90–$0.93
• Area of previous demand, also aligned with SFP
• Bounce possible, but high risk of fading without strength
🎯 First Target: $1.11 (Daily S/R)
🟥 Major Resistance: $1.20 — monthly level, likely hard cap
🚫 Invalidation:
• Clean break below $0.90 opens door to deeper drop
• No setup continuation if zone fails to hold
Plan:
• Short-term bounce trade only
• Not a high conviction long — manage risk closely
• Reassess if reclaim and structure form above $1.00+
📌 Dead cat bounce potential — keep stops tight and expectations measured.

BTC | short bias — Rejection from H4 Bearish OBPrice is currently reacting from a 4H bearish order block ($105.9k–106.4k), which acted as resistance after sweeping local highs. This is a limit short zone, with confluence from lower timeframe SFPs or M15 confirmation entries.
Main Play:
🔻 Short Entry: $105.9k–106.4k
• TP1: $104.8k
• TP2: $103.2k
• SL: Close above $106.8k = short invalidated
📌 Support/Invalidation Levels:
• Break & close below $104.4k = all longs invalid, bearish continuation expected
• Break below $104k = full confirmation of downside scenario
🟢 Bullish Alternative:
If price bounces strongly with confirmation above the sweep zone, a quick long toward the range high (~$106k) is possible — but only on strong recovery.
Summary:
• ✅ Main bias: short from OB after local sweep
• ❌ Longs off the table unless reclaim and structure shift
• 🕵️♂️ Decision zone between $104.4k–$106.8k

LDO S/R reclaim setupBINANCE:LDOUSDT has reclaimed a key 4H support/resistance zone around $0.86–$0.85. This level previously acted as a pivot, and the successful reclaim signals renewed bullish intent.
Entry Zone:
🟩 $0.83–$0.86 (Buy zone)
• Setup activated on reclaim of S/R
• As long as price holds above $0.83, structure favors upside
• Invalidation on clean break below $0.83
🎯 Target:
• First resistance: $1.02
• Additional supply zones lie above for partial profit-taking
Plan:
• Long position valid while price holds above reclaimed S/R
• Invalidation below $0.83 — structure would shift bearish
• Scalp-to-swing setup depending on reaction at $1+
📌 Clean level reclaim + bullish structure = solid R:R opportunity.

BTC — Choppy Range Until BreakoutPrice is caught between key levels:
• Support: $101.8k (4H demand)
• Resistance: $106.6k–107.1k (4H supply zone)
Current structure suggests range-bound price action with low conviction for directional trades until one of these levels is broken.
Plan:
🔁 Range: $101.8k–$106.6k
• Expect multiple drives and fakeouts
• Ideal zone for scalping only, take profits fast
• Avoid breakout anticipation — let the level break first
🚀 Breakout Scenario:
• Flip of $106.6k opens the path to new ATHs
• Break and hold above → long trigger to $110k+
📉 Breakdown Scenario:
• Loss of $101.8k leads to $100k–$98k zone
• Break below $100k = deeper market flush possible
📌 No big move expected until range resolves. Patience and precision are key.

ETH | (reversal setup) — Waiting for Sweep & Reclaim to Trigger BINANCE:ETHUSDT is approaching a key liquidity pocket around $2,440, where multiple wicks have stacked. Price is likely to sweep this zone before any sustained move higher. The current plan favors waiting for the trap → then reacting.
Setup:
🟩 Trigger Zone: $2,440–2,400
• Expecting a sweep of $2,440
• Long setup only valid if price sweeps + reclaims on lower timeframe
• Break below $2,400 = invalidation, wait for new structure
🚫 No entry on first touch — avoid longs without a strong reclaim
🎯 Target Zone: $2,738+
First resistance comes from the H4 supply and the previous range high.
Plan:
• Monitor for liquidity grab and reclaim
• If structure holds — good R:R swing setup
• If not — stand aside, reassess at deeper levels
📌 Smart money needs liquidity. Let it sweep first — then strike.
