GBP JPY Long PositionFundamental Analysis: Although at the beginning of last week there was a decent bullish rally a lot of ground was lost towards the tail end of the week. Depending on how much time is spent on the trade it should be unaffected by scheduled economic events apart from the CPI release on Friday. Brexit always remains an uncertainty and strong volatility can always be expected on this pair.
Technical Analysis : Flat bottom triangle. Pinching and breakout in either direction is imminent. We have reached resistance zone that can be seen on the weekly chart, hoping for a potential bounce back to the upside. This trade is more of a price action trade than a fundamental one.
This is my opinion on this pair.
Always happy to hear other opinions.
Good luck.
4hr

EUR.CAD - Technical Analysis DowntrendCurrency Pair: EUR CAD Trend Predicted: Down Trend, SHORT. All major indicators are showing a Strong Downtrend of EUR CAD. Multiple indicators have been used, including More updates will be available shortly Bollinger Bands and 100/200 SMA.
More updates will be available shortly! Please leave LIKE or a COMMENT to keep supporting!

gbpusd falling wedge pattern falling wedge pattern has occurred which should hopefully break into the upside and reach higher price rates. I'm looking to reach the 1.30 and take profit from there.

BTC/USDT 4h - BTC is not looking good...I will be sitting in tether until all of this calms down. This is a very risky time to be trading, be careful guys. Good Luck!

small shouldered H&S pattern seems 2 b validated; 4hr deathcrossNot a good sign as we plunged below the 1day charts buy/sell line after days of constant support from it. it takes us back to take another look at the 4hr charts strange looking head and shoulder pattern we had our eye on the other day. This pattern seems increasingly more legit and if it was indeed validated the drop target is as deep as the 5.9k area. I have also listed price target points just for the breakdown of the recent flag and the support zone at the old pink symmetrical triangles top trendline seen here on the 4hr chart. Be prepared for any of these 3 to be support but keep in mind with the unavoidable 4hr death cross that is iminite within the next 2 days more downside is almost certainly to be anticipated so the lower bounce zones are probably going to be more legit. If you are ready to be prepared for all of them you are likely to be correct on one of them. As of now breaking below the 1 day charts 50ma doesn't appear to have delayed the trajectorys of the 1day golden cross much yet...if the trajectories remain the same from here we would have a goldencross on the 24th of september...I know we will likely see the 50ma point further downward in the coming days but if the 200ma in turn moves downward at the same rate it shuld hopefully not delay the cross by too much


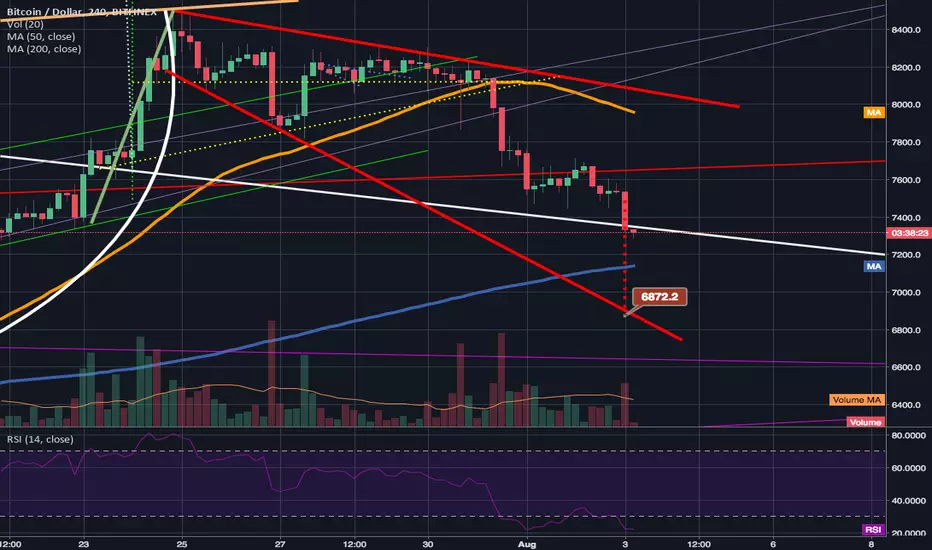
We have broken down from a bearflag & through a big support liThe old adam and eve neckline we broke up from before was holding very strong support after the bearflag breakdown but could only hold for so long before it gave way. Are next 3 big supports are 7.3k the 4hr 200ma(shown here in blue) the 1 day 50ma and the 7k psychological. The bearflag breakdown target could send us all the way to 6.9 or even upper 6.8k. However I am hopefully that either the 200 on the 4hr chart or the 50 on the 1 day chart will provide us our much needed bounce. if we break under 7.2k however then 6.8-6.9 becomes a real possibility.
ADA/BTC 4h - EntryHere is my entry for ADA/BTC. The risk to reward is decent, the only thing to watch out for is BTC losing support at the 7200. Make sure those SL are in place, and good luck!

SALT/BTC 4h - Support needs to hold at .382SALT needs to hold support at the .382 or we will continue down. If you're in SALT, make sure to set your SL, those wicks look nasty. Good Luck!

BNB/BTC 4h - Conservative EntryHere is an entry zone for BNB/BTC that is a bit more conservative. Good luck and don't forget to set that stop!

EURUSD Buy: Fractional Disparity Trades with EURJPY & USDJPYEURUSD: Buy
- Strong Renko support on Daily
- Triangle pattern formation on 4HR
- Double bottom on Daily TDI 1.26%
EURJPY: Sell
- Renko Resistance on 4HR
- Look for Fiabonacci retracement of 50% or wicks to 68%
- Strong downwards slope of EMA's
- Daily strong downwards TDI 1.26%
If some of this sounds confusing feel free to access the Mini-course or Advanced 1.22% courses, and our team chats (all Free):
youtu.be


BNB/BTC 4h - Aggressive EntryHere is my entry point and stop loss for BNB/BTC. The CCI and moving averages look good, we could be due for a little pump. Good luck and don't forget to set that stop loss!

VEN/BTC 4h - My Current PositionHey everyone, it looks like VEN has entered my buy zone, I was able to pick it up at 0.00024310. Don't forget to set that stop loss, good luck!

13) EURUSD bullish gartley on 4hr chart.Follow me and check the related ideas below to learn more details.
Good luck.

12) GBPUSD bullish bat on 4hr chartFollow me and check the related ideas below to learn more details in a larger time frame.

BTC UPDATEFeeling bearish again in the short term. Why?
4 Hr chart:
-Hidden Bearish Divergence
-Trendline providing heavy resistance (repeated rejections)
-Hanging man candle followed by a small shooting star in the works.
We may be dropping down to test the S2 pivot and .786 Fib at the bottom of the golden pocket. Still could have a bullish bounce there, but if we fall through the S2 of the pivots, back to the drawing board!


9) GBPUSD bullish gartley on 4hr chartFollow me and check the related ideas below to learn more details.

4) GBPJPY bearish gartley on 4hr chartFollow me and check the related ideas below to learn more details in a larger time frame.
If you like them please hit the button and let me know it. Thank you.


3) GBPJPY bearish cypher on 4hr chartFollow me and check the related ideas below to learn more details in a larger time frame.
