EURUSD | 31 Jan 2022 - H4 Quick view.4H . Quick Look
As you can see, there is a shift in the market structure.
Today, the sell stop orders were activated below the bottom on Thursday.
And buy stop orders were caught during the New York session above the last low.
I expect more bulls on the 4H chassis
Target 1.1270
4hrchart

USDCAD 4Hr AnalysisWe have created a HH on the 4Hr Chart
However the way that the candles are printing has me concerned
for the bulls. Additionally, the Daily TF has a large top wick
. This wick was created during London Open as price came flying down
liquidating fomo buyers. Im looking for a correction down to 1.263.
Our Daily Resistance at 1.26850 appears to be holding fairly well

EURUSD 4Hr Analysis, Week 4 2022Reasons listed on Chart for why Im bearish
Usually smart to trade with the trend
Unless market Structure Flips
and You get stopped out. Currently in a short here
We have a huge range on the Daily/Weekly TF's to clear
down to 1.105 and eventually 1.10

US Crude AnalysisBullish on the Crude
No reason to countertrend trade unless you have a tested system
that consistently provides a good RR. This 4hr candle is printing a new HH
in market structure. I anticpate 90$ before the end of the week. We have 4 more trading
sessions this week. We would like this 4hr candle to close with a top wick, so we have wicks to fill in momentum

GBPJPY 4Hr Analysis, week 4 2022 We may come up to 155 on the Daily
We may Respect 154.500 Since we just closed below that
price point during the Pre-NY 4hr Candle.
I don't like it a whole lot, Staying out for the Time being
I had just taken a 5:1 RR position that got stopped out,
Trading in Line with my bias, Bearish , Due to the Daily/Weekly TF's
I'm still looking for a retest of lows, at 153.8 and 153.5

BTC Update. Such Wow 4HR TradingUpdate video. The last one out was "every thing looks like doodoo"
I found it funny the last video i made last year in march was calling the sell and when I came back this year and checked it looked bad as well. Maybe I am bad luck for btc? Nah.

AUDJPY : 4H ANLYSIS 💰
FX:AUDJPY
As you can see, everything on the chart makes sense, every move makes sense.
As we can see, the price is in the descending channel and we've just created a new LL,
which means we can expect a pullback that will allow us to make a new LH after what
I expect that price will follow descending structure and make new LL.
If you find this helpful please hit like and follow.


CHFJPY Analysis Headed UpwardWelcome back! Here's an analysis of this pair!
COMMENT BELOW and let us know your thoughts or questions!
**CHFJPY - expect a bounce upward from the buy/support zone as price is respecting previous daily support after a full correction.
We recommend that you enter when the entry criteria of your strategy is met.
Please support this idea with a LIKE if you find it useful and Click "Follow" on our profile if you'd like these trade ideas delivered straight to your email in the future.
Thanks for your continued support!
Brian & Kenya Horton, BK Forex Academy

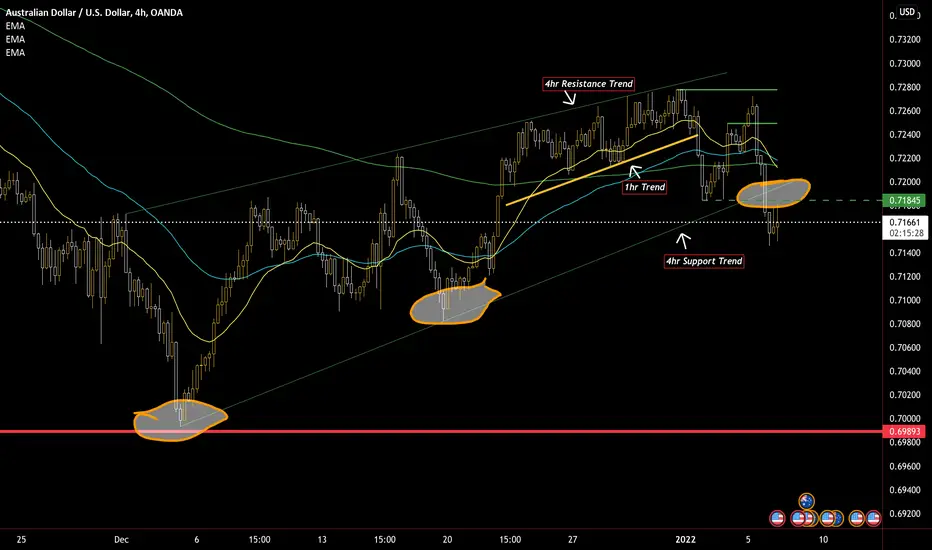
AUD/USD Broken Ascending ChannelAUD/USD 4hr trendline break, in this ascending channel price hit trendline 3 times before it broke. Will be looking for a full retest to last swing high or even trendline than candle play for a possible short-setup. What are your thoughts on this play?
GBPJPY Progression to 158Looking on the HTF, we can see an opportunity for GJ to continue its course to 158.000. Here we will be entering a new zone where we could see price continue to remain bullish.
Will be entering a long position at Higher Volume Periods if price continues to its uptrend. (0700 UTC)

EurChf buy DEBUNKED (Buy)Hello traders
Back with my diamond patterns. Today we will discuss about EurChf buy. Here we can see EurChf is in a diamond pattern with an embedded triangle. The triangle created 2 waves on the left side. An inverted small V-wave and a regular/larger V-wave. Clearly price is in the other half of the formation and now it looks like the first wave is completing(should be completed by end of the day or tomorrow. And the other wave is yet to form. From what I can see this is a 4hour time frame chart.
If you go for this trade you should aim to take profit on the top of the second wave and short it right away. *Do not increase your risk size, use same risk*!!
Good luck if you take this trade. This isn't a financial advice, just a guide and opportunity that has presented it self. Use sensible risk please!!
Good luck
follow me for more future analysis!!
Thank you

REQ Contrating Triangle 4H Chart LONGHello everyone,
On the Request Network (REQ) 4H chart, price has been stuck between the horizontal support and the diagonal resistance for a long time.
First of all, the price will break the diagonal resistance in the very near future, and then not surprisingly, it can be expected to retest this line. Initial buy can be made at current levels or by retesting the diagonal resistance.
However, it should not be ignored that the price bounces off the lower horizontal support (0.3699) in this process. If this happens, the average can be lowered by buying again at 0.3699.
Profit levels are 0.4316 and 0.5143. Please sell gradually while you take your profit.
However, the stop-loss area shown on the graph with the purple rectangle should be taken into account, as risk management should always be acted upon.
Do not forget to put a stop-loss at a point between 0.3000 and 0.3387, which will give flexibility of movement to the price depending on your own risk management.
Farewell

Avalanche (AVAX) 4H chart LONG and SHORTHello everyone,
I studied the 4H Avalanche (AVAX) chart and noticed a nice Fibonacci ABC pattern in the price movement.
It would be much nicer if it would return from 0.50 or 0.618, but I guess the price that once bounced from 0.382 in this pattern will bounce again.
I showed the first Fibonacci levels by writing so that the texts would not be intertwined.
As seen in the second fibonacci plot, I noticed a very nice point (117.36) where the diagonal support intersects the fibonacci 0.382 level.
Although I guess this will be a good buying point, I think it can also be a good breaking point (for short position).
In summary,
117.36 entry price or buy for long position, short position and spot,
for those who want a slightly more secure entry;
126.97 entry price or buy for long position and spot,
110.36 entry price for a short position.
You can examine the horizontal support and resistance lines (yellow ones) on the chart for take-profit and stop-loss levels.
Farewell.

ALICE Short Term LongHello everyone,
A contracting triangle is forming on the 4H chart of ALICEUSDT.
It is likely that the falling diagonal resistance will be broken first, (the price may also break the rising diagonal support at the bottom!) and then it will rise to the resistance at an upper point (around 14.10). Approximately 10-12% movement can be observed.
Be sure to consider the stop buffer zone indicated at the bottom as a purple rectangle.
Have a nice day.

NZDCAD the next thing I’m looking at next week is .... short selNext week I will pay attention to this pattern of movement ....
There are many confirmed clues:
-fibo between 38 and 50
-round number
-support lines
-trend area
if the price breaks through my area and goes towards 100 sma I will treat the trade as a powerless area and I will not trade.
If the price bounces i will pay attention to candlestick bearish reversal patterns and watched to sell in 1h graph...

DOT trading IDEALooks like large C&Handle with rising wedge, pattern within a pattern.
Potential targets
Oversold and anticipating bull run

GBPCAD Short Opportunity4HR OB - 50% remains fresh and untouched.
1HR OB - 50% remains fresh and untouched.
Trading Plan:
1) Set Price Alert
2) Wait for rejection confirmation in candlestick patterns
3) Wait BOS
4) Break down into smaller timeframe like M15 and set Pending sell limit order.
****************************
Alternatively, QML is another short entry setup.
However, this QML is not that typical in structure, hence, assuming the probability is not high.

VET - 4H Chart - Bearish DivergenceSeems like a bearish divergence on VET - 4H Chart
Sold 50% of Trade Positions bought at 10 Cents ~30% Profit
My wish and analysis
Not Financial Advice

THE 4HR 200MA DUMP + A NEW ATH PRINTED AFTERWARDSThis data I have only pulled from about year back. I actually stumbled upon the information one day when I was doing a top down analysis on SPY.
Studying data at least from JUN of 2020 until now, using the 4hr chart in combination with the 200MA. I begin to notice a pattern that was occurring. The market seemed to dip in the 3rd week of every other month back to the 200MA.
The sell offs aren't really surprising being that market will always correct. What's unique is the "behavior pattern" that it/we showed quarter after quarter. We get sell off into the 200MA, it chops around, then by the 2nd week of the following month, we get a sentiment change and a bull run. The market historically has printed a new ATH every time.
This theory once again played out today as of OCT 25th 2021, SPY put in a new ATH. With this run starting roughly two weeks ago.
I timed it perfectly and made some nice profit over the last few weeks. My biggest trade actually was #PINS(Pinterest), I banked 497% on that play. I grabbed a 57.5 call with an entry at 53. price eventually broke out & pushed to $66.
Trades like that can happen, especially when the entire market is overall bullish. Moving forward, try to keep a mental clock of where we are during each month in comparison to where the market is trading. Could save you a headache or 3.

BTC Bearish Divergence in 4H ChartSeems a bearish divergence in 4H chart, i'll be looking for my entry zones after the retracement.
After this cycle we might be reaching to ATH
Red Ellipse: Buying zone
Green spot: Last Trade Bought
Blue Spot: last Trade Sold (11% Gain)
Not Financial Advice
my tought... my wishes

ETH 4HRCan ETH HODL Strong?!! Or will ETH break support?!! 👀 🧐 🤓 🤪 ahh where the 💥BOOM💥@ ETH?!! Keeping 👀 on ETH...

BTC rising wedge can be seen currently a rising wedge can be seen in a 4hr chart, the resistances are coming in around 50450 to 50790, if breaks the resistance line then the technical price will be coming in around 55400 and the supports are coming at the range of 49125 to 49650, if breaks down the support line then the technical price will be coming in around 44500.
