Formation 0-5 Harmonic PatternThe detail is shown in the above Idea.
this pattern confirms Break euro .
5-0 Pattern

DAX: where to start short againLittle bullish correction movement for #DAX
8850 could be a good level to start selling again

GBPCAD LongGBPCAD could be Long:
- Previous Impulse
- 61% Fibo
- Oversold Indicators
- Wave pattern
Entry point NOW (or wait for 1.736)
SL 1.725
TP 1.78

5-0 pattern. Bearish + 20% and bullish model + 51% Real tradingI must say almost all of this movement I took. Short + 8% (instead of 20%). At long + 55%, entry into the long was lower than shown in this example. I will attach the trading idea for which I worked below. She was published here on January 22. I used other methods of analysis and work, but I used this method that I want to talk about as evidence for my methods. The graph shows a bearish pattern , which immediately turns into a bullish 5-0 pattern, a very rare phenomenon. And that's why I decided to make this idea of training.
I want to say that the 5-0 harmonious pattern is very widely used in other markets, rarely in the cryptocurrency, due to the very low professional preparedness of the participants in this market.
Trading in this pattern can be either profitable or unprofitable, in the first place it depends not on the method itself, but on the person who uses this method. The 5-0 pattern is effective in areas of potential trend reversal. Just the pair ETH / BTC was in such a zone.
The profitability of trade largely depends not on the method of trading, but on the ability to use it.
________________________________________
A bit of history.
Harmonic patterns are the development of the idea of ordinary geometric patterns, using Fibonacci levels to more accurately determine pivot points . By the way, I almost never use the Fibonacci levels, as I see without them, what they show. For beginners in trading, it is better to use them.
By the way, who did not know initially in the father of harmonious trading Harold Gartley there were no Fibonacci levels. Only more than 80 years after the creation of the theory and the successful application of Larry Pesavento in practice, did Scott Kearney begin to pervert and sculpt exact numbers for each pattern that are far from real application on the market. It’s not customary to talk about this, but their main business is not real trading, but selling books, unlike Harold Gartley , who was a successful trader in the 20-30s during the Great Depression and became a millionaire! This is not an imaginary millionaire trader, a seller of courses and books, but a real trader who made all his fortune on real trading.
In mid-1935, Harold published his best work and the first book, which, translated into Russian, was called "Profit in the Stock Market."
The initial circulation of this book totaled only 1,000 copies. This book was very popular among traders, despite its very high cost. The book was worth 1,500 dollars, at that time it was possible to buy three new Ford cars for this amount. This is many times higher than $ 1,500 nowadays. One fact is that his books, which were being sold at the height of the Great Depression, let us understand how high authority he enjoyed among the people of the world of finance. The name of the pattern is Gartley Butterfly , which bears the name of its discoverer.
Already after the death of Harold, Billy Jones bought from Harold Gartley's wife the patent rights to the book “Profit in the Stock Market”, then continued to print it in large volumes. And a "perverse improvement" in working methods for making money on book sales started. That's why I have such a negative attitude towards such "specialists."
You have to be, not seem to be.
________________________________________________
5-0 pattern.
Pattern 5-0 is the youngest harmonious model (it is a variation of it with the Fibonacci grid thanks to traders of books on TA). The model usually represents the first pullback of a significant reversal trend. This is a relatively new model with 4 segments and specific Fibonacci measurements of each point in its structure, which excludes the possibility of a flexible interpretation.
Formation of the figure begins with a slight movement of the market, in the direction of a previously existing trend (segment AB), which was preceded by a comparable depth correction (XA). Point B, in this case, should not be higher than the level of 161.8% of point X. This is a fundamental point. If point B "goes" higher, then almost certainly the trader is dealing with short-term correction and the continuation of the existing trend.
The segment of the aircraft, in relation to the segment AB, is formed in the range between 161.8% and 224%.
The CD segment is a correction within the framework of an emerging trend. The correction depth (according to the classical pattern algorithm) should be 50% of the BC segment.
5-0 pattern template measurements:
The segment AB should be from 1,130 - 1,618. before the XA extension.
The segment BC should be a continuation of the segment AB from 1.618 to 2.240.
Point D should be formed at the level of 0.5 segment BC .
The segment AB must be equal to the segment CD, (AB = CD).
_______________________________________________
There are bullish and bearish formations of this pattern on the market. The graph shows both variants of the 5-0 pattern.
Bullish 5-0 pattern.
As you can see, the structure of the price movement at the time of the formation of the 5-0 pattern is generally very similar to the model of the Dragon figure with the development of goals. I made the ideas of training on this model of a figure and will fix it in ideas under the article.
Point 0 - the beginning of the downward movement, point X - the first correction upward, point A - the completion of the correction and the beginning of the fall down, point B - the end of the fall and the beginning of the strong upward movement, should be located at a level between 1.13-1.618 from XA, that the point C - the completion of a strong upward movement should be located between 1.618-2.24 from AB, point D is the end of the fall and the beginning of the upward movement, here we are trying to enter the market. The input should be at the level of 50% correction from the BC .
Bearish 5-0 pattern.
The structure of the bearish model of the 5-0 pattern is remotely similar to the model of an asymmetric head and shoulders or an inverted Dragon figure with a working out target.
Point O is the beginning of growth and the beginning of the formation of the model, point X is the beginning of correction down, point A is the beginning of growth and completion of correction, point B is the end of growth, should be located at the Fibonacci projection level between levels 1.13-1.618, point C is the end of a strong fall and the beginning of growth, point D - completion of growth, the place where we should open a deal for sale should be at the level of 50% correction from the BC .
Conservative traders are looking for additional confirmation before entering the trade. The 5-0 pattern can be either bullish or bearish . Goals can be set at the discretion of the trader, as the pivot point may be the beginning of a new trend. The common stop loss levels lie beyond the structure level beyond point D or the next important level for the Fibonacci sequence.
_______________________________________
Objectives for this pattern.
As it is a reversal pattern, which can act as a reversal pattern of the whole trend (the emergence of a new trend). You understand that there can be no clear goals, unlike simple figures. If you really get to the beginning of a new trend, the goals can be huge. It is important here not to exit the market prematurely. So that your profit does not turn into a loss, use the movement of stop-loss as the upward movement develops, but take into account the volatility of the instrument.
In this example, on the chart on the ETH / BTC pair, you can clearly see what the goals for this pattern can be.
The bearish model made a profit of + 20%
Channel support stopped a further drop in prices.
The bullish model made a profit of + 51%
The first goal is the resistance of the rising channel + 18%, as we see the price there was delayed for some time.
From this zone the reverse corrective movement to the support of the channel could take place. But, the price has successfully overcome this zone.
In total, the profit is + 51% of the entry point (point D).
In two models, the profit in theory was + 20 + 51% = + 70%.
But the reality is different, I have a profit of + 8% + 55% = + 60%
I rounded the interest for a better understanding, I will say one thing, there was no liquidity at the maximum to reset a significant position, and therefore the profit is much less than the theoretical one on the schedule.
______________________________________
Violations of the pattern 5-0 .
More than any other pattern, the 5-0 structure presents a unique opportunity for decision making when the area of opening positions breaks through. In all 5-0 models, the best moment to enter depends on various ratios within the structure. When trying to make a deal while forming an unsuccessful 5-0 pattern, the trader still needs to look at the prevailing trend and at models at smaller time intervals.
Of course, the 5-0 pattern is not an ultra-precise model, and it may not work out even in the most correct situations on the market. What to do if the price has broken through all levels and left the channel, in such cases, the authors of harmonious trading offer quality ideas for opening positions. The first target in this case may be the area of correction 0.886 from the entire movement. Therefore, if prices fell outside the channel and broke through the 50% area, then we should expect continued decline.
______________________________________
Advantages and disadvantages of pattern 5.0
Despite the popularity of this pattern, I would like to first consider the disadvantages of the pattern. The main of its shortcomings should be called the poor "recognition" of the figure. After all, not all formations in the real market, exactly correspond to the ideal book example. In this example, I used exactly the ideal option for the ease of presenting information, and a person who is interested in adding this pattern to his arsenal of trading can also look for more complex formations for work. I would advise beginners to look for ideal models for work, as they are more predictable.
The developers and "popularizers" of the pattern emphasize its versatility. In their opinion, the pattern works with equal efficiency on any trading instruments and at any time intervals. If in the first part this statement is undeniable, then with regard to timeframes, the use of the pattern raises many questions.
On short timeframes, this pattern is not effective due to the high content of "white noise" and which does not allow to clearly identify and build the boundaries of the pattern.
Over long periods of time, the created corridor is so wide that, in fact, it can only indicate the direction of the trend (and even then in the long term). Thus, the efficiency of using this figure very much depends on the correctly selected timeframe. The ideal timeframe for work is 4 hours-1 day.
Remember the most important thing, this 5-0 pattern is effective in areas of potential trend reversal.
_____________________________________
I wrote above that I will attach trading ideas for this pair that I worked on.
Which trading ideas made it possible to take profits in shorts + 8% and long + 55%.
1) This one worked in short when the head and shoulders formed. Published November 24th.
ETH / BTC Pivot Points . Ascending Triangle - Head and Shoulders
Result in short + 8%
2) The trading idea for which he worked in long. Published January 22.
ETH / BTC Coin operation. Reversal zones. Double bottom .
The result is now + 55%, the entrance was practically at the very minimum price when confirming support.
Perhaps we will see a reversal of the main trend by ETH18, if the price closes above the downtrend line (red line).
Also, in the idea of training on this graph, you probably all noticed which figure is being formed and how much you can earn from fulfilling its target.
Remember, trading is a game of probabilities.
Who trades from the situation created in the market - earns.
Who trades on the basis of what he wants - receives a loss.
The crowd trades out of their desires, not market probabilities. The crowd always loses.
From the pixels of thinking of individuals, a way of thinking of the crowd is created.
Thanks to the thinking and desires of the crowd, we earn.
The more stupid a society is, the higher the percentage of earnings in it is smart.
To earn, you need someone to lose money. No other way.
Under the article, I have fixed 31 learning ideas.
I didn’t even know that I already have so many of them.
Knowledge and experience are power!!!

5-0 pattern. Bearish + 20% and bullish model + 51% Real tradingI must say almost all of this movement I took. Short + 8% (instead of 20%). At long + 55%, entry into the long was lower than shown in this example. I will attach the trading idea for which I worked below. She was published here on January 22. I used other methods of analysis and work, but I used this method that I want to talk about as evidence for my methods. The graph shows a bearish pattern, which immediately turns into a bullish 5-0 pattern, a very rare phenomenon. And that's why I decided to make this idea of training.
I want to say that the 5-0 harmonious pattern is very widely used in other markets, rarely in the cryptocurrency, due to the very low professional preparedness of the participants in this market.
Trading in this pattern can be either profitable or unprofitable, in the first place it depends not on the method itself, but on the person who uses this method. The 5-0 pattern is effective in areas of potential trend reversal. Just the pair ETH / BTC was in such a zone.
The profitability of trade largely depends not on the method of trading, but on the ability to use it.
________________________________________
A bit of history.
Harmonic patterns are the development of the idea of ordinary geometric patterns, using Fibonacci levels to more accurately determine pivot points. By the way, I almost never use the Fibonacci levels, as I see without them, what they show. For beginners in trading, it is better to use them.
By the way, who did not know initially in the father of harmonious trading Harold Gartley there were no Fibonacci levels. Only more than 80 years after the creation of the theory and the successful application of Larry Pesavento in practice, did Scott Kearney begin to pervert and sculpt exact numbers for each pattern that are far from real application on the market. It’s not customary to talk about this, but their main business is not real trading, but selling books, unlike Harold Gartley, who was a successful trader in the 20-30s during the Great Depression and became a millionaire! This is not an imaginary millionaire trader, a seller of courses and books, but a real trader who made all his fortune on real trading.
In mid-1935, Harold published his best work and the first book, which, translated into Russian, was called "Profit in the Stock Market."
The initial circulation of this book totaled only 1,000 copies. This book was very popular among traders, despite its very high cost. The book was worth 1,500 dollars, at that time it was possible to buy three new Ford cars for this amount. This is many times higher than $ 1,500 nowadays. One fact is that his books, which were being sold at the height of the Great Depression, let us understand how high authority he enjoyed among the people of the world of finance. The name of the pattern is Gartley Butterfly, which bears the name of its discoverer.
Already after the death of Harold, Billy Jones bought from Harold Gartley's wife the patent rights to the book “Profit in the Stock Market”, then continued to print it in large volumes. And a "perverse improvement" in working methods for making money on book sales started. That's why I have such a negative attitude towards such "specialists."
You have to be, not seem to be.
________________________________________________
5-0 pattern.
Pattern 5-0 is the youngest harmonious model (it is a variation of it with the Fibonacci grid thanks to traders of books on TA). The model usually represents the first pullback of a significant reversal trend. This is a relatively new model with 4 segments and specific Fibonacci measurements of each point in its structure, which excludes the possibility of a flexible interpretation.
Formation of the figure begins with a slight movement of the market, in the direction of a previously existing trend (segment AB), which was preceded by a comparable depth correction (XA). Point B, in this case, should not be higher than the level of 161.8% of point X. This is a fundamental point. If point B "goes" higher, then almost certainly the trader is dealing with short-term correction and the continuation of the existing trend.
The segment of the aircraft, in relation to the segment AB, is formed in the range between 161.8% and 224%.
The CD segment is a correction within the framework of an emerging trend. The correction depth (according to the classical pattern algorithm) should be 50% of the BC segment.
5-0 pattern template measurements:
The segment AB should be from 1,130 - 1,618. before the XA extension.
The segment BC should be a continuation of the segment AB from 1.618 to 2.240.
Point D should be formed at the level of 0.5 segment BC.
The segment AB must be equal to the segment CD, (AB = CD).
_______________________________________________
There are bullish and bearish formations of this pattern on the market. The graph shows both variants of the 5-0 pattern.
Bullish 5-0 pattern.
As you can see, the structure of the price movement at the time of the formation of the 5-0 pattern is generally very similar to the model of the Dragon figure with the development of goals. I made the ideas of training on this model of a figure and will fix it in ideas under the article.
Point 0 - the beginning of the downward movement, point X - the first correction upward, point A - the completion of the correction and the beginning of the fall down, point B - the end of the fall and the beginning of the strong upward movement, should be located at a level between 1.13-1.618 from XA, that the point C - the completion of a strong upward movement should be located between 1.618-2.24 from AB, point D is the end of the fall and the beginning of the upward movement, here we are trying to enter the market. The input should be at the level of 50% correction from the BC.
Bearish 5-0 pattern.
The structure of the bearish model of the 5-0 pattern is remotely similar to the model of an asymmetric head and shoulders or an inverted Dragon figure with a working out target.
Point O is the beginning of growth and the beginning of the formation of the model, point X is the beginning of correction down, point A is the beginning of growth and completion of correction, point B is the end of growth, should be located at the Fibonacci projection level between levels 1.13-1.618, point C is the end of a strong fall and the beginning of growth, point D - completion of growth, the place where we should open a deal for sale should be at the level of 50% correction from the BC.
Conservative traders are looking for additional confirmation before entering the trade. The 5-0 pattern can be either bullish or bearish. Goals can be set at the discretion of the trader, as the pivot point may be the beginning of a new trend. The common stop loss levels lie beyond the structure level beyond point D or the next important level for the Fibonacci sequence.
_______________________________________
Objectives for this pattern.
As it is a reversal pattern, which can act as a reversal pattern of the whole trend (the emergence of a new trend). You understand that there can be no clear goals, unlike simple figures. If you really get to the beginning of a new trend, the goals can be huge. It is important here not to exit the market prematurely. So that your profit does not turn into a loss, use the movement of stop-loss as the upward movement develops, but take into account the volatility of the instrument.
In this example, on the chart on the ETH / BTC pair, you can clearly see what the goals for this pattern can be.
The bearish model made a profit of + 20%
Channel support stopped a further drop in prices.
The bullish model made a profit of + 51%
The first goal is the resistance of the rising channel + 18%, as we see the price there was delayed for some time.
From this zone the reverse corrective movement to the support of the channel could take place. But, the price has successfully overcome this zone.
In total, the profit is + 51% of the entry point (point D).
In two models, the profit in theory was + 20 + 51% = + 70%.
But the reality is different, I have a profit of + 8% + 55% = + 60%
I rounded the interest for a better understanding, I will say one thing, there was no liquidity at the maximum to reset a significant position, and therefore the profit is much less than the theoretical one on the schedule.
______________________________________
Violations of the pattern 5-0.
More than any other pattern, the 5-0 structure presents a unique opportunity for decision making when the area of opening positions breaks through. In all 5-0 models, the best moment to enter depends on various ratios within the structure. When trying to make a deal while forming an unsuccessful 5-0 pattern, the trader still needs to look at the prevailing trend and at models at smaller time intervals.
Of course, the 5-0 pattern is not an ultra-precise model, and it may not work out even in the most correct situations on the market. What to do if the price has broken through all levels and left the channel, in such cases, the authors of harmonious trading offer quality ideas for opening positions. The first target in this case may be the area of correction 0.886 from the entire movement. Therefore, if prices fell outside the channel and broke through the 50% area, then we should expect continued decline.
______________________________________
Advantages and disadvantages of pattern 5.0
Despite the popularity of this pattern, I would like to first consider the disadvantages of the pattern. The main of its shortcomings should be called the poor "recognition" of the figure. After all, not all formations in the real market, exactly correspond to the ideal book example. In this example, I used exactly the ideal option for the ease of presenting information, and a person who is interested in adding this pattern to his arsenal of trading can also look for more complex formations for work. I would advise beginners to look for ideal models for work, as they are more predictable.
The developers and "popularizers" of the pattern emphasize its versatility. In their opinion, the pattern works with equal efficiency on any trading instruments and at any time intervals. If in the first part this statement is undeniable, then with regard to timeframes, the use of the pattern raises many questions.
On short timeframes, this pattern is not effective due to the high content of "white noise" and which does not allow to clearly identify and build the boundaries of the pattern.
Over long periods of time, the created corridor is so wide that, in fact, it can only indicate the direction of the trend (and even then in the long term). Thus, the efficiency of using this figure very much depends on the correctly selected timeframe. The ideal timeframe for work is 4 hours-1 day.
Remember the most important thing, this 5-0 pattern is effective in areas of potential trend reversal.
_____________________________________
I wrote above that I will attach trading ideas for this pair that I worked on. Which trading ideas made it possible to take profits in shorts + 8% and long + 55%.
1) This one worked in short when the head and shoulders formed. Published November 24th.
ETH / BTC Pivot Points. Ascending Triangle - Head and Shoulders
Result in short + 8%
2) The trading idea for which he worked in long. Published January 22.
ETH / BTC Coin operation. Reversal zones. Double bottom.
The result is now + 55%, the entrance was practically at the very minimum price when confirming support.
Perhaps we will see a reversal of the main trend by ETH18, if the price closes above the downtrend line (red line).
Also, in the idea of training on this graph, you probably all noticed which figure is being formed and how much you can earn from fulfilling its target.
Remember, trading is a game of probabilities.
Who trades from the situation created in the market - earns.
Who trades on the basis of what he wants - receives a loss.
The crowd trades out of their desires, not market probabilities. The crowd always loses.
From the pixels of thinking of individuals, a way of thinking of the crowd is created.
Thanks to the thinking and desires of the crowd, we earn.
The more stupid a society is, the higher the percentage of earnings in it is smart.
To earn, you need someone to lose money. No other way.
Under the article, I have fixed 31 learning ideas.
I didn’t even know that I already have so many of them.
Knowledge and experience are power!!!

Trade Ideas Educator: GBPAUD SharkGBPAUD is a very volatile pair; to trade this, one must have a mental preparation that market can still reverse against you after riding on a 100pips+ profit.
Now this present as a third-chance entry to engage this trade of the countertrend trading. You might be asking, "Hey then, why is this trade still in your list?" Well, the volatility of this that attracted me. Be prepared to get stung out multiple times before being rewarded.
As long as the market didn't gap up or gap down too much, I will still be looking for a shorting opportunity.

SPX Weekly Is a Falling Knife until it hits 2745Bullish 5-0 Level @ 2745 and .618 retracement of the latest wave. Don't try to catch the falling knife until it hits that number. Until then, neither panic nor go long preemptively.

Trade Ideas Position: GBPAUD SharkA bearish shark pattern that converges with the 5-0pattern for a shorting opportunity forms at the peak of the band isn't that great?
Don't underestimate the small wick over there, it is close to 50pips difference, and the tip of the 5-0 Pattern happens to be the HOP(Harmonic Optimal Price) on the bearish shark setup.
I've placed a sell limit order to engage this trade, and that gives me a fantastic Reward: Risk. Aggressive Traders can decide if they are going to enter the trade.

SP500 long term target 2300 then 1650We will have a dead cat bounce up to ~3200 to activate a butterfly target at 2300. Right on previous major LOW. We need AT LEAST 3200 for this to work.
Then another dead cat, and a fall to 1650, to complete a shark pattern.
Once we reach 1650, market could range between 1650 and 2500 for years.
It's blowing my mind how the 161% extensions (golden number) are aligned with key levels.
At 3400, 2300 and 1650.

EURUSD: bear signal29/02-2020
This time we are looking at a bear Gartley 886 completion with symmetry between London session closing prices on the 15 minute timeframe. This should trigger sell limit orders for swing trading.
Im going to try and place my entry point around 1.104-1.105 with initial stops around 1.106 or X and look for an extension target.
Our last trade on EU, all though we saw a decent decline hit target 1, I didn't find the trade very rewarding:
Here the rejection with 89 WMA as support and the triangle have a fibonacci time confluence. This should have been interpreted as a bull 5-0 reversal, not a bear shark continuation, and it would have been a very good trade with a steady advance in this market:
Anyway, its all about the next trade and learning from past mistakes right?
Good luck to all trading EUR/USD for the coming week
Happy trading folks

EURUSD 5 - 0 Pattern Indicating Continuation of Larger DowntrendEURUSD 5-0 pattern on 4h chart, CCI divergence , PRZ confluence with a fairly decent support turned resistance. On 15m chart possible double top formed marking the reversal inside PRZ of 5-0 formed by 1.00 AB=CD reciprocal and 0.500 Fib retracement.
Stop loss is place just above high of double top and might be a little tight, if I'm stopped out I will look for another signal to attempt a second entry.
Target 1 I'll close half my position.
Target 2 I'll close 25%
Target 3 I will close the rest.
Because this price move is a possible continuation of the larger downtrend I have a greater degree of confidence in waiting for price to hit target 3.
Entry - 1.10277
SL - 1.10542
Target 1 - 1.09143
Target 2 - 1.07690
Target 3 - 1.06014

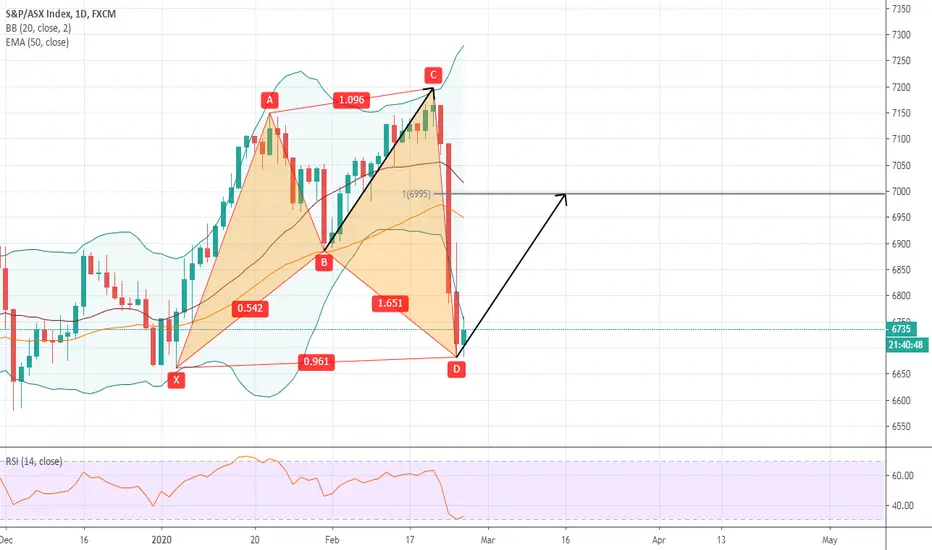
AUS200 Daily Harmonic Shark Pattern into Possible 5.0 patternAlready long, low risk high R:R trade, target to start adding to my longer term short is around the possible 5.0 pattern completion
Stop is directly below the last two days lows, not giving it much room as it will either retrace now or if it fails it will likely breach the lows to take out stops first and there is always another opportunity to get back in later
Alternate AB=CD zone shown by the copied arrows
I love large bars as it shows all of the orders are flushed out of there so moving back through them is so much easier...
Trade Ideas Position: EURUSD 5-0A bullish 5-0 Pattern setup a countertrend trade. The trading decision will depend on how the candle closes on the 1-hour timeframe.

Possibility of 0-5 Harmonic Pattern FormationDetail of Harmonic Pattern is shown on H1 Time Frame with higher Accuracy.

BRITISH POUND / U.S. DOLLAR (GBPUSD) WeeklyDates in the future with the highest probability for price direction reversals

Trade Ideas Position: AUDCAD 5-0PatternMost traders only have a single target for a 5-0 pattern, I can have up to 2 targets for a trend trading setup.
Trade has already engaged, if you love to receive the levels, complete the registration at the link(3) and I will be happy to add you into our community.

EURUSD TECHNICAL LONG TERM BUYthe elliot waves just drawn for a view ( not perfect )
there are a weekly and daily strong pivoot that touched by price and wants to grow up
#EURUSD BUY now at
BUY : 1.09158
SL : 1.08744
TP1 : 1.09993
TP2 : 1.10791
TP3 : 1.11594
TP4 : 1.12298
USE 5% OF MONEY MANAGEMENT
BY : Mohammad Reza Ebrahimi Moghaddam #forex #iran #sultan_trading


BTC Bullish 5-0 Could take us back to $14k before reversalBTC has been showing some strength in the new year and has formed somewhat of a bearish shark that may very well turn into a Bullish 5-0, I have two paths here drawn out for the scenario that can play out if BTC pulls back at $14k. One is a pivot from the 50 percent retrace and the other is the 61.8 percent retrace at around $9600 which is confluent with a strong support at $9625
Something to note s that this is a bearish shark first and a bullish 5-0 second and it can reverse anywhere between the .886 and 1.13 retrace in which case from the actually pullback within that zone we might have to refib later on but this is the general idea.
These areas may also prove to be a good place to re-enter the market if you haven't already to take a shot on getting in on the trend continuation.


XAU patenal 5-0 patten, shortHi, traders,
I am LUO, this is my first strategy on Gold in English, if you like it, give me a focus, thank you.
XAU patenal 5-0 patten, short

XAU 0-5 Harmonic Bullish Harmonic Pattern.0-5 Harmonic Bullish Harmonic Pattern
it is starting a Bullish trend.

ShortI am expecting it to hit 0.67567 maybe a strong reversal might occur and it's going to be up for some hours .
