EURUSD 1.33 by 2020 ?We have a perfect 5-0 pattern and bullish AB=CD.
Target is 161% of CD.
1.13 must hold, otherwise the pattern is invalidated
5-0 Pattern

EURUSD Bullish 5-0 Monthly ChartThis is a bullish 5-0 pattern, formed in monthly chart.
The first bounce from 50% retracement (around 1.1450) reached 38.2% retracement of February high to August low around 1.1800/1.1780 before the pair resume downtrend and reached AB=CD projection.
Stop loss below 1.1180.

EUR/USD Transition From Shark To 5-0 PatternFinal Shark Reversal around 1.12-1.09.
As of 1.12 now the 0.50 retracement of DC sits around 1.19, concluding the potential 5-0 pattern

Bearish 5-0 on EUSDLooks like we have a nice Bearish 5-0 on the EURUSD 4H chart. My sell limit is at 1.13800
The take profit fib level lands on a significant level also (the red line)


GBPNZD Bearish 5-0 In PlayThis pair has been unpredictable as of late, but I think the Bearish 5-0 is still in play. I don't have the margin to take this trade so I might have to wait for price to reach the red box for the sell point.

GBPAUDThis is a possible Bearish or Bullish 5-0 pattern. Waiting for confirmation to see which pattern price will form


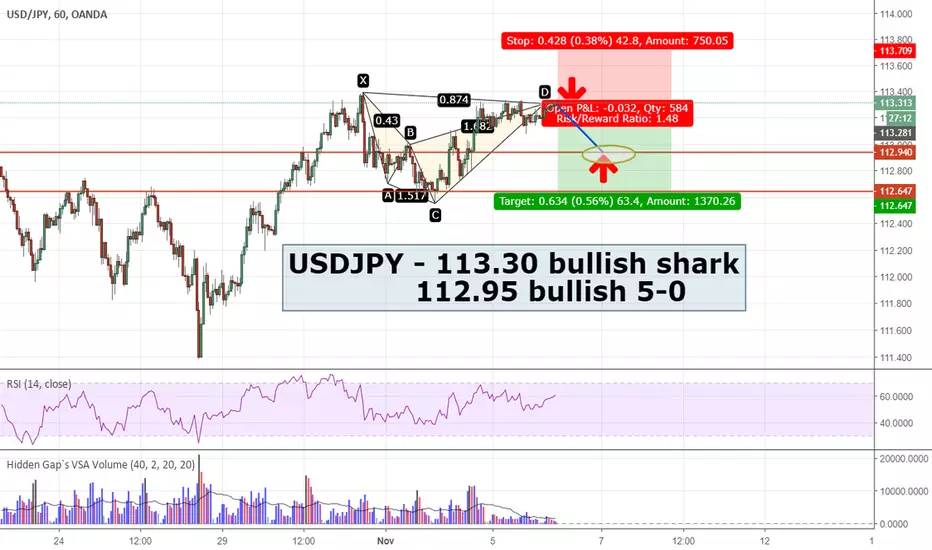
USDJPY - 2 Sharks and a 5-0 across 2 timeframesUSDJPY - 2 Sharks at different timeframes, what can you expect?
On the hourly chart, USDJPY has completed a bearish shark.
We are right there at the PRZ right now.
If the market reacts and USDJPY reverses from here, we can expect it to reach 112.95 which is the TP1 of the shark pattern.
Small Shark execution
PRZ 113.30
SL 113.70
TP1 112.95
TP2 112.65
At 112.95, USDJPY can either fall further or rebound from a bullish 5.0 pattern.
In the bigger timeframe, we have a big shark completing at 114.50.
Therefore, my GUESS is USDJPY will rebound from 112.95 after the 5-0 completes to confirm the bigger shark at 114.50.
Big Shark execution
PRZ 114.50
SL 115.70
TP1 112.90
TP2 111.70
Trade Ideas Analysis: NZDUSD Double TopWaiting for the restest to form up at this level to continue the trend trading setup.
Will be taking 2 targets, exact entry, stops and targets will be shared to my inner circle.

Trade Ideas Position: USDJPY 5-0 I will be waiting for the market to retrace back to the sell zone and look for shorting opportunity as a counter-trend trade.
Exact Entry, Stops and Targets will be shared to my inner-circle

Trade Ideas Position: CADJPY 5-0Will have to look how this 1-hour candle close, if it close as it is I will engage the trade to Long and may even take extended targets.
Entry, Stops And Targets shared to my inner circle.

EURUSD, 5-0 Pattern, 1H, Buy5-0 pattern comleted on red area. There can be buy opportunity.
______________________________________
You can see my social media links below.
______________________________________

TSLA Potential Bearish 5-0 Update October 10, 2018I'm long to the 386 retrace. Than potentially short to targets on chart.


long nzd/usd for completed 5-0In daily chart,decline trend seems weaker.
Price now been support by fresh demand zone,and ma89,and D point of 5-0 look completed.

CHF/JPY Bullish 5-0 after Bullish AB=CD CHF/JPY potentially forming a bullish 5-0 pattern
Action : Short
Open : 116.250
Target : 115.500
then
Action : Long
Open : If price bounce around 115.150 - 115.250
Target : 115.900


Trade Ideas Position: EURJPY H1 EclipseWhen pattern overlap pattern overlap pattern and they are all valid, I call it the Eclipsed.
Yeah!
We have 5-0, the infamous Double Top with Div and Bear Bat all still valid. What will you do?

Trade Ideas Position: EURJPY H1 5-0Waiting for Double Top to short this and pretty much believe we will see a divergence when that happens, which happen to be one of the criteria for me to engage the trade.


INTC 5-0 Pattern - contrarian upside move trade 56.5 targetINTC 0-5 pattern - the likely resolution of this pattern is downside, but if it can't go down, then it violently pushes upward to 88.6%. This is a contrarian trade, lot of people are betting downside move, options are skewed a lot to downside, so likely it goes up, the risk to reward is to upside.
