Breakout is confirmed 50 SMA now acting as support!Exciting to see we have confirmed the breakout of the wedge....wedge breakouts tend to have very reliable projected target prices and this one goes all the way to $10335. I have updated my chart to show which fib lines, trendlines, and moving averages can act as support or resistance along the way. The only EMA I have on the chart currently is the T-Line...simply because the Simple moving averages have been acting much more like support/resistance lately than the eponential moving averages have....if that changes I will certainly include any pertinent EMAs on my chart. For now we can see that what was strong resistance at the 50MA (aka the buy sell line) has now flipped to support. This is huge because if we can continue to ahve the 50 MA act as support for 4 more 4 hr candle closes that will mean we are back in a buyers market. Considering the reliability of wedge patterns achieving their breakout targets I'd say that is a high probability, but still something to keep an eye on if for some reason it dips back below it. the current resistance is a previous green fib line as you can see. It bounced down off it and then confirmed the 50MA as support after bouncing up off the 50MA a very very good sign. I'd say keep an eye on the 50MA to make sure it maintains support...if so I have a feeling the green fib line will be resistance for a very temporary amount of time and we will be back in the buyers market soon....suggesting that the second quarter of this year will hopefully be a bullish one.
50ma

Hammer ShortSSl recently has been recovering from a market correction. However, even tho the coppock curve and the ADX are saying this could be a buy, I see a hammer candlestick forming. This shows that the prior trend could be changing. So, I put a short position below the 50 MA. Also, volume seems to be decreasing.

ETH showing short-term bullish traitsThis idea is following the same pattern as my previous XRP idea. If the lagging span of the Ichimoku cloud pierces the thin cloud above then we would have a clear buy signal. Futhermore the VWAP has crossed the 50 MA quite aggressively.

Potential short term 20% increase for XRPWhile XRP remains predominantly bearish, we have a few signals here that could indicate a short-term uptrend to our previous resistance (red-dotted line). We have pierced the Ichimoku cloud and the VWAP (pink line) has crossed over the 50 MA (blue line). If the lagging span of the Ichimoku cloud (black line circled in yellow) pierces the Ichimoku cloud then we would have a strong bullish signal for a potential 20% increase in the price of XRP.

General electric breakout failedThe stock is trading below 50 day moving average. Failed to breakout. The technical bottom is 15.25 dollar. When bullish on the stock buy more on that level. Short term the stock can decline more.

BTCUSD 4hr- H&S pattern - Possibly trend reversal?Spotted a Head and Shoulders pattern on the 4 hr chart BTCUSD. The neckline of the H&S pattern crosses close to the 50 day MA. Can we expect a short term downtrend if the trend crosses these levels? Leave your thoughts below. If you have any comments/questions please let me know.
Cheers.

Earnings ReportThe 200 MA is providing resistance and the 50 MA is providing support. This is most likely a flag pattern, and the ADX is about to go green so will most likely be bullish. But, since the earnings report is coming out today, I have chosen to create buy and sell orders.Also, due to past earning reports the volatility is very high so I expect the same to happen.


Carnival ready to bounce ?This stock loves bouncing up from 50 day moving average. RSI is just above 50 and Money flow seems like going to reverse back to buying territory - did not stay much in selling really.


Another Flag PatternGBP/EUR has formed a flag pattern and to see its seems we have a false breakout, thats represented by the RSI showing overbought, so I would wait for the rebound to lower trendline for support and then the partial rise will be complete and then its a buy. Also the 50 MA is showing support and has crossed over with the 20 MA.Also, the price is in a separate area in the pitchfork

Bounce on the 200MAGdx has a tendency to bounce on the 200MA. I am presently holding GDX shares and I will probably switch my position to DUST if the stock goes below the 50MA. If the stock is capable of crossing the 200MA, it would be a great bullish indicator.


Bullish & Low RiskWatch for LNTH to make a move back up to past resistance around $9.70, Price has just broken above the resistance line and it is also just above the 50ma which has been acting as a dynamic support for quite some time. Also volume has been increasing, MACD looks like it is soon going to crossover and the Squeeze Momentum indicator is currently bullish.

Momentum Squeeze Play, GSVIncreasing volume, MACD crossover, broken resistance line, squeeze momentum on. Price target of $3.00, for just under an 18% return.

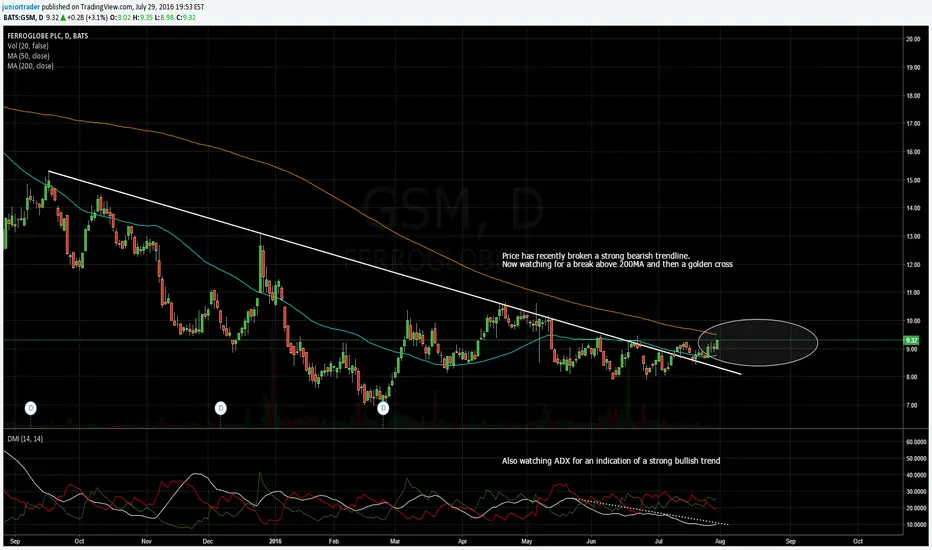
Watching for Golden CrossA long term bearish trendline has recently been broken, and the downtrend seems to be reversing. Watching for price to break above the 200MA to go long and then wait for a golden cross.
EURJPY Analysis Week of July 24, 2016Weekly:
Price is currently in a downtrend. The 20 moving average is currently being used as a dynamic resistance. We will use this towards our trading plan. The end of the week candle closed as a bearish pinbar. The size of that pinbar in relation to the previous bullish candle is not convincing that price is to continue its way down.
Daily:
Looking at the daily chart we can see a nice well formed channel. Price broke through lower and decided to get back into the channels range. This indicates that price has some bull movement before its continuation down.
4 Hour:
Looking at the 4 hour chart we can see a nice structure forming. A good area to go long is between support 114.500 - 115.500. A safer route would be to wait for price to reach resistance 120.500 - 121.500 to short for its continuation down.
Wishing everyone a good trading week!

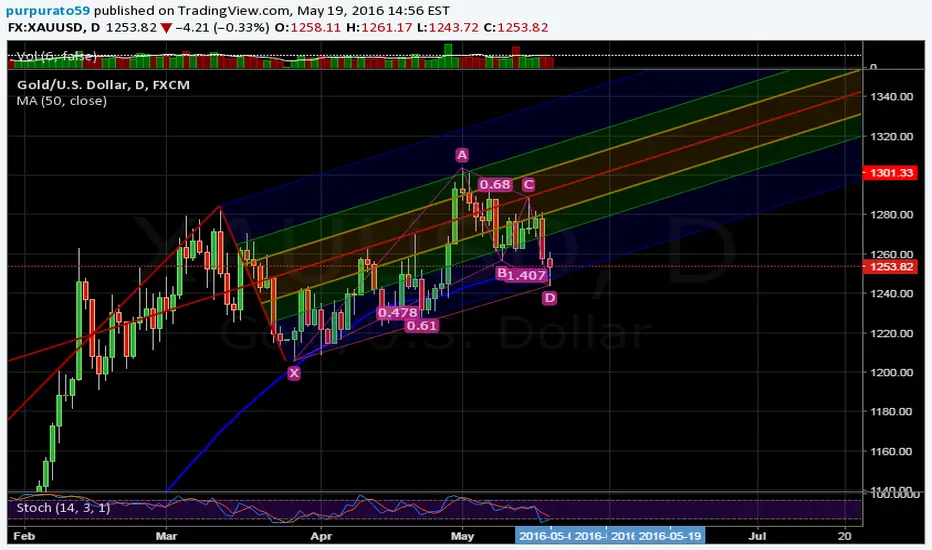
End of correctionThis large pitchfork describes price action for the last month and seems to be still in play. The last week downtrend correction seems now to be over and we are now headed back to the primary uptrend that's been in play for the whole 2016. Three different items point to this:
- We visited the lower part of the pitchfork and the daily candle is now forming a hammer.
- Today's wick just touched 50MA and is now closing above.
- There is a two step bullish continuation pattern that is now complete, marking the start of a new bullrun that will finish somewhere above 1300 at the upper part of the channel.
Gold kumoAfter taking a breath to gather strength on the uptrend, price is now sustained by the Ichimoku cloud as well as the 50MA that have been acting as support.
Other indicators like the ADX are already signaling the resume of the uptrend and this should keep on up till 1245. At that point, depending on the strength of the trend, it will possibly keep on to test last top on the 1280's.

If GBP dips below hourly 200 MAIf GBPUSD dips below the hourly 200 MA it could open up to a deep drop to the hourly 100 MA and 50 MA.
