Please Be Calm FET/BTC #FET $FET #FetchAIHere we see our FET daily chart and you can see the pullback we had ! Almost 25% down from our recent high over 1500 sats . As you can see we've hit a number 8 in red on our TD Sequential 9 indicator , and I expect it will hit the number 9 later today . That is usually a sign of a trend reversal and so I would expect this to go up soon . Pullbacks are normal and healthy for any chart to continue on to the upside . So we are actually under 1100 sats right now but I don't expect it to go too much lower before the turnaround . You see that pink arrow on the chart ? That is pointing at our light blue 50 MA line ( 50 week moving average . ) And that's a very strong support area . I'm not expecting to break below it . Targets for FET stand - a return to 1500 area and above that going to 3200/3420 area . Fib targets will be in linked chart below . Please be calm ! Pullbacks are normal .
50ma

Parabolic Moves ! FET/BTC #FET #FetchAI $FET Here we see our FET 3 day chart and as you see we broke out last night ! Coming very close , as expected, to our high from last Summer near 1550 .With Mainnet coming in 3 days we seem to be entering into a Parabolic upward movement here .You see where the green arrow is on the chart ? That shows an obvious Kumo Twist on our Ichimoku Cloud - ( also known as a Kumo Breakout ) and it's very Bullish ! . We are also about to have a Golden Cross happen with our light blue 50 MA going to cross up and through our dark blue 200 MA . Next target above us is 3200 - 3420 area ,which is near strong resistance and our .236 fib. I'll link the fib targets in my other chart below . This looks great , extremely bullish chart . Now there can always be some pullback along the way as well as consolidation - I'm not saying we go to 3200 and above tomorrow - but it is definitely looking good for April and beyond !

It's time to ZOOM OUT and get REALPlease have a look at this chart. Scroll all the way back to 1999.
At present day we are very far above the 50d moving average. It's frightening how high we are.
Bearish divergence from Jan 2020 to present day.
Bearish divergence in 2018, leading to a 20% retracement.
Bearish divergence in 2007, leading to the global financial crisis.
Bearish divergence in 1999, leading to the tech/telecom bust.
History will repeat itself, I think. We are currently in a very worrying position. Look at what these bearish divergences have shown in the past. To return to 50d MA levels would mean a 13% correction for S&P 500. If we fall below that, we should start considering a full blown crash/bear market.

Bears Got Smashed By the Musk, He needs Help!My previous prediction was playing out just as I predicted because the trading bots come on everytime BTC dips from a new high and they follow patterns. Heard $1 billion in btc was moved to a Coinbase Custodial Wallet yesterday. Then at 230am this morning I saw the craziest thing I've ever seen. Bitcoin shot off like a rocket from 53k all the way up to 56k smashing the bears. They couldnt handle it. What do you know its our Bitcoin friend Elon Musk . But he needs help. We need to help him drive up over the 50day ema . So lets go and drive this baby to the moon.
Hodl 'til the wheels fall off!

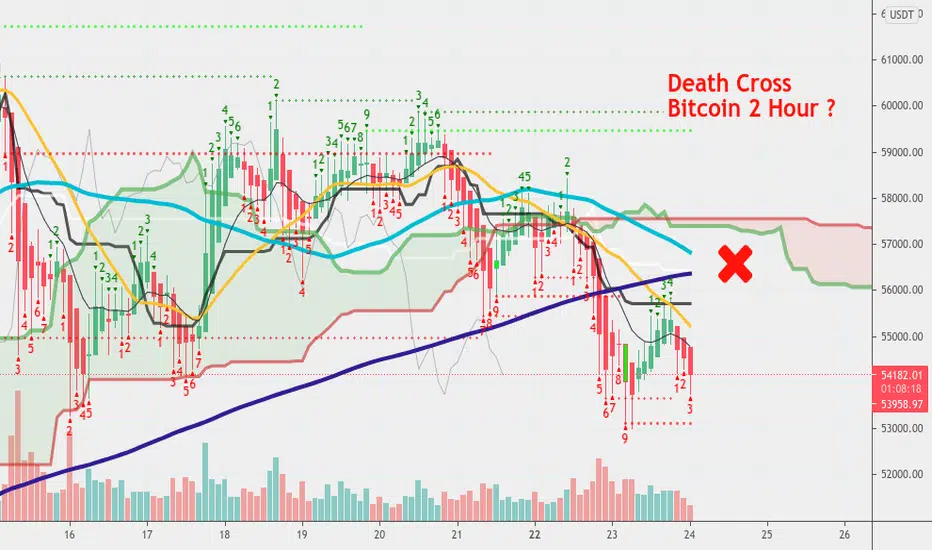
Hoist The Jolly Roger BTC/USDT #Bitcoin $BTC #BTC Here we see our Bitcoin 2 hour chart . Can you see that red X on the chart ? Well, X marks the spot where we may see a Death Cross happening
very soon . A Death Cross is when our light blue 50 MA crosses down and through our dark blue 200 MA . This should bring downward price movement. It's a very bearish event - though keep in mind this is the 2 hour chart . While it's hard to know how low this can go it wouldn't be impossible for Bitcoin to actually go sub 50k here . Please understand we are still long-term bullish for the rest of the year even if we see more pullback on Bitcoin. This will also be great for altcoins which could see a little altseason starting soon.
The Hidden Divergence (1)Stock price and indicator have hidden divergence. This maybe means the price will extend the trend.
Tips:
This is forex, not a stock. But the tips should apply as well.
2014 Jun 6, price and stochastic have a hidden divergence.
Stochastic is to value price momentum. Also can be treated as if stock overbought or oversold.
The divergence is a hidden divergence. A hidden divergence is for a price higher lower, but indicators are lower low. Or for a price lower high but indicators are higher high.
The hidden divergence means the price will continue the trend.
Here the trend is uptrend, means probably price will go up.
2014 jun 6, stochastic showed oversold, possibly price bounce back.
The price also dropped almost on 50 ma, possibly price bounce back.
It is below 200 ma, should bias on downtrend. But here is a buy hint, so can buy , but not a very strong one.

$NNDM - Held Through Earnings$NNDM is having a R2G Morning and looks to be making a green engulfing candle. Earnings missed, but maybe the low was already in after all this selling. Looking to test 50MA, then we will see where it goes.

The Regular Divergence (1)Stock price is lower low, but indicator is higher low. This divergence can be a trading opportunity.
Tips:
This is forex, not a stock. But the tips should apply as well.
2014 apr 28, price and stochastic have divergence.
Stochastic is to value price momentum. Use 8,3,3 as the parameter can wipe out some market noise.
The divergence is a regular divergence. Over 200 ma, should have bias of doing uptrend. Hence, for regular divergence, should only trade when price is lower low, but indicators is higher low.
If below 200 ma, should be reverse, which is for regular divergence, should only trade when price is higher high, but indicator is lower high.
The price also dropped on 50 ma, more probable to bounce back.
Stochastic works only for a range price move. For strong trend, not working. Here the value is about 20, and not in a strong trend swing, means oversold. More probable to bounce back.
There is also a horizontal support below the price.
Over all these, a strong buy hint is here.

Easter Bunny WAN/BTC #Wanchain $WAN #WanHere we see our 1 day WAN chart from Binance .You see a Golden Cross appears imminent with that light blue 50 MA going to cross up and through the dark blue 200 MA , probably in a few weeks . When that happens our Ichimoku cloud will almost certainly have a Bullish twist up called a Kumo Twist , or a Kumo Breakout. This is excellent news on a higher timeframe and WAN looks good to break up to the resistance above us at 3750 .
Another target above that appears to be 6200 ( another 1 day resistance . ) Price right now is around 1700 - I think WAN will do great this year though . Thanks for reading !

April Jewels -3 Day Golden Cross in Apil ? FET/BTC #FetchAi $FETHere we see our FET 3 day chart on Binance . You can see our light blue 50 MA is looking to turn up into our dark blue 200 MA and that could mean a Golden Cross happening here on our 3 day chart as it just recently already happened on our 1 day chart ! In case you didn't know - a Golden Cross is extremely Bullish especially on higher timeframes like 1 day , 3 day , and 1 week charts . And a Golden Cross is when our 50 week moving average crosses up and through our 200 week moving average - which looks like it will happen on our chart sometime i n April where you see the rocket on my chart . This looks great already but add in the fact that FET is having a Mainnet at the end of March and you have an extremely great scenario for all of us who are trading or holding FET . I personally would like to see Fet approaching 5800 - 6000 sats in Summer but we almost certainly will go over 1000 sats soon and a target still seems to be that blue line on my chart near 1550 - which was our high from summer 2020 . Looks great and Good Luck !

Anticipation ... VRA/BTC #Verasity #VRA $VRAHere we see our VRA BTC daily chart from Kucoin. RIght on track our light blue 50 MA is going to cross up into our dark blue 200 MA . That's the Golden Cross we've been talking about. I'll link the related chart below . This is still very Bullish for our chart and as you see we wicked up to touch that red line ( that's the VPVR indicator .) If Altseason is starting then what are the possible targets here for VRA ? Well , our fibs could be the targets and next one above us is this :
4827 - that's our .236 fib
7728 - that's our .382 fib
10072 - that's our .5 fib
12416 - that's our .618 fib
Let's see how this does in 2021 - thank you for reading !

Hold The LIne FET/BTC #FetchAi $FET #FetHere we see our daily FET BTC chart from Binance . You see that pink arrow on my chart ? It's pointing at the dark blue 200 MA line .That's the 200 week moving average . It's a strong long-term indicator and you can see we are sitting on top of it . None of our candlesticks has closed below it . So we are still bullish in my opinion . I don't think we will break below that dark blue line , I believe FET will see a Golden Cross very soon ( a Golden Cross is when that light blue line which is the 50 MA will cross up and through that dark blue 200 MA . It'll break through . ) That will be a massive upside for us . FET looks fantastic so don't be worried by short-term pullbacks or a bit of ups and downs ,because in a volatile Bullmarket that's normal . Have a great day . Golden Cross idea linked below . Thank you .

You Can Do It ! VRA/BTC #Verasity #VRA $VRAHere we see our 1 day VRA BTC chart on Kucoin .You can see VRA is already inside the Daily Ichimoku Cloud and gone to the top of it . Now there seems to be some slight retrace and we will probably have consolidation and eventually we will break up out of this Cloud . When though ? Well you see that blue rocket ship on my chart ? That is approximately where our Golden Cross might happen - looks to be in March sometime, so fairly soon. What is a Golden Cross ? It's a very good Bullish event in which our light blue 50 MA line will cross up and through our dark blue 200 MA line . That's the 50 week moving average and the 200 week moving average.Looks like this is going to be a Golden Cross happening , and fairly soon. The black arrow is pointing towards where our light blue 50 MA line should start moving up .This will take us higher . We are sitting near 5 sats right now. I still feel one target above is 9.17 sats as that's an area of confluence on our VPVR indicator. Also above us at the .236 fib line is another target near 48.27 sats ! That's almost 10 times up from where VRA is right now ! A 10x move would be great for the Verasity Community. Have a great day everyone .


Legend of The Golden Cross FET/BTC #Fetchai $FET #fetHere we see our FET daily chart from Binance . You'll notice we are about to have a very Bullish event on this chart ! The Golden Cross . What is a Golden Cross ? Well,that's when our light blue 50MA ( or 50 week moving average ) is going to cross up and go through our dark blue 200 MA ( or 200 week moving average. ) These are long-term moving averages and are fairly good indicators of bullish upside coming when they cross like this ! You see the purple rocket on my chart ? That looks to be approximately where we will get a cross up , could be in early March . This should be extremely good for FET and remember FET also has a Mainnet coming in March ! All good stuff ! Looks great ( also I hope you are having a great day . )

$LAZR - 50MA bounceAnother one we were in last week and sold once it breakout of the range it was in. As you guys know I like the bounces off the 20man after pullbacks, but this one, just like BLNK bounced right off the 50MA today. Worth keeping an eye on as the market rotates back to momentum stocks.

SCHNEIDER - Above the 50MANYSE:SNDR
SCHNEIDER NATIONAL INC #SNDR
- The stock exited the bearish trend in January 2021, touching almost the USD 24.00
- #SNDR retraced to what was the resistance for the whole month of December 2020
- In addition, #SNDR is now sitting above the 50 MA signalling a potential change of trend
- The RSI and MACD are both pointing to the upside
BUY @ USD 22.05
PT1 @ USD 23.30
PT2 @ USD 25.50
SL @ USD 20.50

$RUN - Bounce and Gap Fill?This one has some potential. Bounce off the 50MA and has a gap to fill above to about $75. Not in it. Just sharing.

GBP/JPYlooking for a nice short sell opportunity to the downside
once JPY breaks floor nothing is standing in the way of TP zone

USD/CADSitting on a hard floor of support , if dollar weakens then should see more bearish pull down to TP

Long on AWK - 1st target $ 160NYSE:AWK
- 50 MA holding strong (similar pattern)
- MACD showing reversal
- Entry $ 154.26
- First target $ 160
- Second target $ 165
- Stop Loss $ 148

Otter Tail #OTTR - 50MA holding strongNASDAQ:OTTR
- 50MA holding strong
- MACD sloping up
- Entry price @ 41.02
- 1st target @ $ 42.18
- 2nd target @ $ 43.47
- Stop loss @ $ 39.49

Every #EVRG - 50MA holding and MACD sloping upNYSE:EVRG
- 50MA holding strong
- MACD sloping up
- Entry price @ 54.94
- 1st target @ $ 57.00
- 2nd target @ $ 58.00
- Stop loss @ $ 53.00
