Will Bitcoin Try New All Time High?Bitcoin's Volume Profile Support at 103,900 is holding.
Hold here (again) and likely another test for new ATH.
Breaking it means retrace down to the 94k-93k 50% Retracement + Volume Profile region.
Then, time comes into play with the tried and tested Bitcoin Daily Ichimoku Cloud Strategy. If Chikou (used as momentum) does not clear the cloud at the same time as price the bull trend is neutral but still intact.
If the move happens quickly the Support region is likely to hold and retest the highs once more in weeks to come...
2 situations reverse the trend to bearish:
1. Price moves quickly to sub-90k
2. Price moves more slowly to the 50%-VP region.
Both situations get Chikou out at the same time as price. Timing and price come together to flip the trend to bearish.
Trade Wisely
50retracement

Ethereum = MySpace of Crypto?I have been watching COINBASE:ETHUSD flirt with 2750 for the better part of May as all crypto has gone "risk on" with Bitcoin's All-Time-High push. This level is the 50% Retracement of the last major high in December 2024 to the low of April 2025. There is also significant Volume Profile Resistance from February matching this price action level. This level is good for a short and can even be managed with tight risk given the clear price structure at this level.
Normally I am a pure technical trader but I have a bearish fundamental bias on Ethereum...
Fundamentals:
Ethereum is dying. I know that may be unpopular to say but it is losing "network effect."
Ethereum used to be the standard for the smart contract use case of cryptocurrency but it is being replaced by competition namely Solana. I ask, "what does Ethereum do that Solana does not do cheaper/faster/better?" Even the President of the United States used Solana to create his scam meme coin. Value judgements aside the use case of smart contracts to create new tokens has proven to be popular and the market has chosen which chain to create them. It was no longer Ethereum.
The best analogy to Ethereum's fall from dominance would be to look back at social media companies like MySpace. At some inflection point for various reasons users choose to leave a platform for another. That is network effect and unfortunately for Ethereum it has already begun to lose it.

Never bet against Elon?Never betting against the man is a pretty solid strategy. Nevertheless, considering I am long shares I want to take this textbook trade to hedge (again).
This morning on my spike alerts list was $NASDAQ:TSLA. With an opening high of 354.56 which swiftly closed back inside the range a 30m spike was created. The ATR Clearance fits my criteria to consider this a valid spike to play.
Add to this the context of the Daily. NASDAQ:TSLA is riding the 50% of the big move down on the Daily at 351.39. The spike combined with the Resistance makes this a "have to take" trade.
Playing this with July 300P Options.

UNH: Knife or Generational Opportunity?News today that NYSE:UNH suspended 2025 guidance and CEO stepped down led to a massive route... right down to the 50% Retracement from the 2008 bottom to the former All Time High.
This is potentially a big opportunity for a long term position at this level: 322. I would have preferred the level to be matched by a Volume Profile level but the nearest one below is at 244. I can still see a good risk adjusted trade back to the median of the down move initially and onward to a full recovery.
I took a moderate position in tax advantaged accounts for the long term hold and will keep an eye on this level for a more tactical setup (a spike or further price action to confirm the hold).

"This is fine" on Nasdaq?The general sentiment coming into this week is that the bear trend is over and "things are fine." Maybe. This morning there was a 30m opening spike on NASDAQ:QQQ I cannot ignore. It is happening right at the big Daily 50% Retracement of the leg down:
The level is even more prominent on Nasdaq futures and one can add the Volume Profile Point of Control to said level.
CME_MINI:NQ1!
Playing this with June Puts on QQQ but going to use today's high as a tight stop. We'll see what "Sell in May" brings...

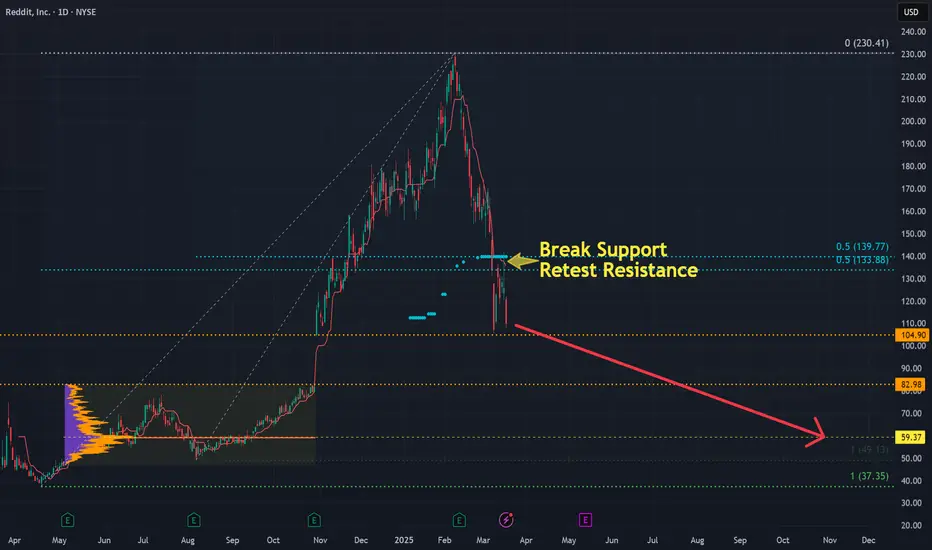
Reddit in the Valley of RiskReddit NYSE:RDDT has entered my textbook "Valley of Risk" period where the stock has a chance to hold its 50% Retracement of a major trend, fails, and even now has the added confirmation of retesting said 50% Support as overhead Resistance.
There is now only the gap level at 104.90 which if broken will probably fill. Then it will be on to test the post-IPO accumulation Volume Profile POC at 59.37. I think upside risk (if one were short) is mitigated by the prevailing sector rotation out of tech. There is no alpha to save this stock to speak of outside of the tide going out.
Things like this tend to slow bleed out. I might be tempted to take a long dated 60 Put but shorting shares may be more appropriate.
The Palantir of tradingA Palantir, if you did not know, is otherwise known as a crystal ball; a seeing stone. It was what Saruman used in Lord of the Rings to "see" and that ultimately led to his corruption by Sauron. I've seen this stock corrupt the career of aspiring traders...
I was asked my advice on Palantir NASDAQ:PLTR . I don't like to give "advice" on what for other traders to do... but I will say what I have done, what I am doing, and tell you a story that hopefully help traders be better.
I bought PLTR at an average price of about $9/share. Great! Not really, it was July 2022, and I bagheld all the way down to $6: a -33% unrealized loss over about a year of time. But what I had done was only purchased 200 shares. My position was relatively small; it didn't bother me. I slept just fine.
I was encouraged to buy PLTR by a good trading buddy. We would talk and trade every day for years since the pandemic. He was super bullish on this stock and I really bought it and held it in solidarity with my friend.
Then in May 2023 the stock finally took off. I had my shares and my friend traded PLTR options. However, they were short duration options. In the May - August rally he multiplied his account many times. More money than he had ever had in his young life. Things were going great. He was finally RIGHT! But then...
The stock stopped moving. Unfortunately, my friend had taken his success and tried to repeat it. Options need movement. PLTR did not move enough. He lost it all. He left our group and quit trading altogether...
...just before the August 2024 rally.
If you like the company, OWN THE SHARES
Since the pandemic I have tried my best to educate traders that the short term, gambler's mentality inherent in options is a path to disaster for the vast majority of traders. Patience. It's hard but it pays.
I still have my shares. They are up big. They are pulling back, sure. But I don't care. I was small, I have a very low buy price, and I can just wait.
Now that PLTR has moved though... inevitably people want it. Since the start of the year I've been asked repeatedly about buying it. What I tell people is that any tech or volatile stock like this WILL have AT LEAST a -50% (usually more) pullback. Be patient. I do not get interested until that happens. Even then it still may get even cheaper.
Be patient.
Trade wisely.

Microstrategy Enters "The Valley of Risk"A term I have coined, "The Valley of Risk", describes a price chart which has had a prior very strong bullish trend, pulls back to its 50% Retracement Support, and then fails to hold it... entering a long, grinding, bearish deflation which coincides with the heavy negative emotion being felt by those still holding the bag.
Inside the "Valley of Risk" nothing one does is correct:
If you sell... it will bottom and rally
If you buy... it will continue down
If you baghold... it will continue to go down until you cannot stand it and #1
This is just a pattern of human emotion being reflected on a price chart... which is what price charts ultimately are. It is best to avoid going into the Valley of Risk and have strict rules against bagholding. Deploy your capital elsewhere that there is a better potential rate of return.
When I teach about this concept I always look back to Zillow NASDAQ:Z . This was a stock I bought "on a dip" at 111 and made the right decision to sell my position at a loss at 102 when the stock price violated the 50% Support. This allowed me to avoid the horrible Earnings miss gap and the final -74% depreciation. My position still would not have recovered as of writing.
As I published months ago, it became clear to me that the over exuberance and fancy financial buzz words being thrown around about NASDAQ:MSTR were signs of a ponzi about to collapse. Well, the "Bitcoin nuclear reactor" has cooled and the leverage baked into Microstrategy would be its downfall. That has now come to pass. There are some other interesting elements of price action which have been textbook in this decline that I want to talk about in this post.
The 50% Retracement:
The operative level for the last 3 months has been 328. This is the 50% Retracement of the YOLO rally. In the pullback from the ATH 440 became the 50% Retracement Resistance.
The Ichimoku Cloud Breakout Confirmed:
The other textbook setup was when the Ichimoku Cloud Breakout was confirmed by the Lagging Span entering clear bearish space after price had exited the cloud. Interestingly, this happened at the same exact day as Bitcoin; last Friday. You can read more about this strategy and my 14 year study of how effective it is in my recent Ideas:
So what now?
That is the eternal question of "The Valley of Risk". There is never a good answer because the technical supports have been broken.
Personally though I need to answer this question for my bearish positions. The most logical point to look would be the Volume Profile POC at 165. However, Microstrategy is going to move concurrent to Bitcoin itself and knowing the past bearish cycle patterns this week, through brutal, will find a bottom. I do not believe it will be the final bottom only that price may hesitate at some point for perhaps even a month.
My trade management
This week I will be selling premium against my long Puts, which go out to 2027, to offset my Theta while still remaining short Delta.

Nucor (NUE) Materials Play for 2025NYSE:NUE announced earnings this morning. The subsequent opening price action triggered a Spike Alert on the opening 30 minute bar which brought the stock to my attention.
This spike was generated by the Earnings opening price action. Earnings beat estimates and the stock rallied. However, where the spike breached... and more importantly held... was what interests me.
Price Action Support
The combined supports of:
The 50% Retracement of the trend from January 3rd to January 21st
The Volume Profile Point of Control (POC) for the Trend
...being tested and held are a great sign that price has found support and is respecting it.
To further my analysis of the stock for a long term hold I graduated up to the Weekly Timeframe.
The same two confluences of 50% Retracement and Volume Profile POC have come together and prior to today's Earnings they held as Support in late December 2024.
Finally, we can move up to the Monthly and see the Ichimoku Cloud holding as a potential Ichimoku Cloud pullback.
Fundamentals
NYSE:NUE is a company that has been around a long time. It is a Materials Company (Steel, mostly) with a long price history to look back on. Doing so I noticed that the company's price trends were highly cyclical covering many years. The current pullback that price is within represents a close to -40% discount from the All Time High. The stock's performance will likely depend on economic demand in the coming years.
Trade Management
For this Entry to be valid it should first hold today's Earning Spike low and continue to rally. In the longer term price should not violate the low set during the month of January 2025. Holding both would be great and be exactly as I plan this trade. Violating either or both means the Support is wrong.
Market Thoughts
As a final thought; a lot of investors ask me questions about whatever is "HOT" and in the news. Clearly, this week (and for many weeks) that has been everything tech. You will not find me very interested in chasing these stocks. Not until they have had huge (-50%, -60%) drawdowns. These plays (like Nucor) are the ones I try to find to start my year and then hold them for long to come.
Trade wisely.

Why Buy LLY?A textbook spike trade... that's why!
Every morning the stock market open gives us opening volatility spikes on the first 30 minute bar. Most are noise but when that rare one comes along that fits my rules AND has multiple matching confluences... it's time to "Strike at the Spike!"
This setup has going for it:
At a 50% Retracement of the recent trend (from November 18 - December 4)
At the top of a Gap Level
At the Volume Profile Point-of-Control for the last year of price action (see below)
With a Spike that my indicator shows >80% ATR Clearance I consider the baseline for a trade; this one is 150% so it definitely fits the rules. I would take a spike if there were only 2 of those matching levels above. Targeting the local high for the first take profit at 834.
Here is the Daily chart for just how key this level is:
Full disclosure: NYSE:LLY is and has been one of my biggest holdings; having owned the stock for over a decade.

Look for Spikes to get Long EthereumLate to the crypto bull run? Maybe not! Technical Analysis is not about predicting the future... it is about identifying opportunity.
COINBASE:ETHUSD has been bullish for a few weeks and I've been patiently waiting for it to trigger a setup. I got what I was looking for on Tuesday of this week and it made for a great teachable moment combining my Spike Indicator, 50% Retracements, and Volume Profile. Another "MUST TAKE" opportunity that traders should study and look for...

The TSLA Trade Setup You NEED To Know!Even if you did not know anything was going on this week... NASDAQ:TSLA had an amazing long setup on Monday. I posted about it then and wanted to make a followup educational video because it was so amazing! It was a setup I HAD TO TAKE because it was all my rules come together!
Traders need to know these individual components:
Earnings Pullback
Gap Levels
50% Retracement
Spike
And when some or all of them come together you take the trade

Post-earning spike and holdI missed this yesterday when it happened in the morning open. NASDAQ:TSLA did a spike at the 50% Retracement of the post earnings rally. Support is established... the stops know where to be. Looks like a good rallying point.

Bitcoin Short Position UpdateBeen short INDEX:BTCUSD since April with AMEX:BITI (Proshares Bitcoin Short ETF). The media writes "reasons" that Bitcoin is down each day but real reason Bitcoin is down any day is the failure to confirm new ATH in April.
I do somewhat lament my bearish bias because I missed a good long off 50% level in this liquidation but I'll go into why I remain bearish in this post.
Zoom Monthly to see why Bitcoin is bearish: No one buying.
"ETF inflow" reports don't matter. On-Chain analysis doesn't matter.
To reach fabled 6-figure levels investors need YOLO in with reckless abandon. Clearly not happening in price action.
Technically this manifests on the chart with monthly bars trying but failing at the 2021 ATH. Also at a basic technical level lower highs and lower lows.
For the second time in this post-ATH-fail range Ichimoku Bullish breakouts have failed and Bitcoin has gone confirmed bearish.
Ichimoku is a best used trending strategy so it sucks when this price action happens but over time has proven itself effective in managing long term positions. Long term holds should be OFF right now in its current Ichimoku trend state.
So where is BTCUSD going?
Back to the ETF Launch.
Either by karma or irony... markets have a tendency to punish overhype. It would be the most irrational (thus market rational) thing for price to return to whence it began. This is where I begin taking profit on my short. I may even be interested to get long depending...

Monero back in "Fair Value"Of all cryptocurrencies I see Monero KRAKEN:XMRUSD differently as a good "store of value" which is private. That makes me a little looser with my trading guidelines for other assets. Monero has also proven difficult to trade in recent years... it has had some volatile swings but overall has broadly kept its value.
The recent cryptocurrency downtrend, led by Bitcoin, has finally caused the otherwise resilient Monero to break back into the 140 range. 140 on Monero for the last several years I have seen as "fair value" to accumulate. This is also the 50% Retracement of the recent trend and the Volume Profile Point of Control.

XYL Multiple Levels of SupportAlso on my morning Spike scanner came up NYSE:XYL (see below for the spike on the 30m timeframe).
I especially like this Support level as it has many matching components:
50% Retracement Level. My bread and butter. The most important Retracement Level.
Volume Profile node. Not the POC but a key level of price and volume here.
Ichimoku Cloud. A long flat SKB with the Lagging Span far away from crossing into bearish territory.
This is the Spike that triggered me to look and find price acting such a way at Support:
The take profit target is easy to find; the POC on the Volume Profile for the bullish trend. The stop is between the current VP node and the next significant one (which could be next support but no reason to take that much risk).

Bitcoin Spike at ResistanceBitcoin HELD the Last Support noted in my Idea last week. That save INDEX:BTCUSD from going bearish. However, it is not out of the woods yet.
Today Bitcoin spiked the 50% Retracement Resistance at 64652. This sets up a short trade where if the high of the spike is broken "you know you're wrong" for a low risk/high reward trade. If the Spike high is broken... Bitcoin may trend bullish and even resume the full bull trend onward to 100k+. However, if this spike is a reversal and price retests the lows of last week, this will trigger a full trend flip to bearish via the Ichimoku cloud.

AMD at 50% RetracementFriend asked me to do a Volume Profile for levels on NASDAQ:AMD
It has hit and held the 50% Retracement. The next VP node is 157.79. One could be patient and wait but I like the long now. "You know when you're wrong" (it breaks 157.79) so I know where to stop out.

Trading Bitcoin FuturesTo keep actively trading Bitcoin short... I am watching and trading Bitcoin futures. This morning there was a 30 minute timeframe Spike right at the level I have been watching since after the ETF launch: the 50% Retracement of the "Sell the News" phase. I am looking for price to hold this level as Resistance and retrace at least back to 41000 in short time.
Higher Timeframe Update:
The area of Resistance that is the 50% of the ETF Selloff is where Bitcoin has retraced to over the last week. On Monday 1/22 I was able to hedge my Puts by selling shorter dated Puts against them to hedge and offset theta. I closed them yesterday.
Broadly, Bitcoin is still in this battle zone from the ATH to the November 22 low.
Mainstream Adoption
Back in the old days... Bitcoin was best traded spot on margin on exchanges. Now, all the reputable exchanges are KYC and the new ones popping up would never fool an old timer like me into putting money there. I have even received spam here on Tradingview from exchange reps trying to get me to do affiliate programs. No, never. Bitcoin is now a heavily traded asset with countless derivatives. It is truly mainstream.

JP Morgan Short off All Time HighWith the stock market making new All Time Highs fresh new opportunities for contrarian trades are going to be somewhat scarce. Thanks to a viewer on my Livestream (every Friday on Tradingview: 4pm EST UTC-5) I was made aware of a short setup I like on NYSE:JPM
Context
This price action is happening at a test of the past ATH set in November 2021. Last week the Earnings announcement pushed price intraday above the high only to close well below the key Resistance level of the former ATH. This is a false breakout signal or as I like to identify them as: Spikes.
The Spike
The Spike occurred on Earnings. I have found that false breakouts on earnings have a very high probability of signaling a reversal. The significance value (135% ATR) is within my rules. It took until the following week for price to actually pull back to the proper entry point of the Spike bar's Tenkan Sen value at 172.48. What these factors mean I go over during my Livestream.
The Trade
How I am expressing this trade is in a combination of short shares and Puts.
In choosing my Put strike I look for where I see price going as a target via technical analysis. In this case it would be the 50% Retracement of the bullish trend around 155.
For expiration I consider the prior bullish trend that got price up to the high I am reading as a false breakout to enter. I project the time that trend took, add an additional month as a time buffer, and then typically take that expiration. Unfortunately, an option expiring in March as this technique would suggest puts the expiration too close and just before earnings.
A note about options and earnings: In the 4 weeks prior to earnings very typically a stock's options will experience a rise in IV (implied volatility). This rise in IV and the Greek Vega can increase the prices of all options often offsetting the value lost to theta time decay. This is a very advantageous condition if a trader is long single options. Therefor, I chose the April expirations to give myself the potential for the IV push. I will likely close the options the day before earnings regardless of where price may be. Options are a coin flip.

Opportunity on PFEA viewer on my Livestream Friday brought to my attention that Pfizer NYSE:PFE is coming off a major low (COVID Low) and has done a pullback to the 50% of the Impulse Move off said low. This is why I love doing Livestreams and having a trading community... idea crowdsourcing!
I like these setups especially as the S&P 500 and many stocks within it are making new 52 Week highs leaving many wondering "what's a good reward/risk at this point?"
The pullback on the Weekly bring price to the 50% of what I call an "Impulse Move" off the low: the first major reaction to confirm that price is respecting a low. See the Daily chart below for a lower timeframe view:
I would not want to hold the position if price breached the major low. My first Target would be the 50% Retracement of the Bearish trend at 40.32. This sets up a proper 3 to 1 Reward/Risk Ratio. I will likely express this trade with shares purchased but may seek to buy Calls as well.

Wallgreens Long for 2024This morning I received a volatility alert on $NASDAQ:WBA. The stock had earnings today and the resulting price action was bearish down to a significant potential support level.
The Trade
The Weekly the Ichimoku 9-period (red line) shows that short term 50% level as it goes flat providing a Weekly entry point. The risk is that price makes another major low. In my trading toolbox I call this setup a "TS Recap." I discuss these during my Weekly Livestreams here on Tradingview. I was able to enter my position earlier this morning and price has responded favorably by the time of writing (fill before you shill).
The Context
Since November 30, 2023 NASDAQ:WBA has had a bullish trend off the recent major low. I call these type of moves "Impulse Moves" because they represent significant buying over a short period of time that have the potential to be the first move of a full trend reversal. I look to take them as trades (or long term positions entries) when they perform a pullback to their 50% Retracement. This is what it looks like on the Daily timeframe:
If we go up to the Monthly we see that NASDAQ:WBA is doing this price action at historic, 2008 and 2000 lows. This is a significant point and worth the risk for a long with a time horizon to span 2024.

Bitcoin Spike on DailyOne of my primary technical analysis trading tools is that of False Breakouts or as I identify them; Spikes . I have found that when prices moves quickly in one direction only to return in the opposite direction within the same or following candle this indicates a potential reversal with a high probability. The corollary to this concept is that if price does then break that "spike" bar the trend can be confirmed.
The Spike
I have been watching the price action of Bitcoin exceptionally close over the last few weeks as the 2023 bullish trend approached and has stubbornly held a major Resistance. On the first US market open trading day of 2024 Bitcoin made a push to break the recent consolidation. However, the following day Bitcoin price reacted with a nearly -10% drop. Such a daily move is not uncommon in Bitcoin but where and when it happened is significant.
I operate under the logical thesis that if something is bullish... it should GO. There should be no such major rejections if the trend is strong. To have such a sudden rejection qualifies as a "Spike" and I created an indicator that identifies these for me to filter out the noise. That is exactly what happened at this point and place in Bitcoin price action.
This spike bolsters my conviction that the 2023 bull trend of Bitcoin has reached its zenith.
The Levels
If this spike proves to be a bearish reversal then the supports I identify based on past price inflation and 50% Retracements are:
35,400
30,700
If price surpasses the high of this week significantly the next level of Resistance is the March 2022 high of 48,200:
Expressing the Trade
Contrary to popular memes there exists already Bitcoin based ETFs. Rather than deal with the theta decay aspect of options the symbol AMEX:BITI is the SHORT Bitcoin ETF. The price action is distorted but it also exhibited the Daily Spike price action. This instrument is the one I will use to express bearish trades on Bitcoin going forward.
I talk about my Spikes as a trading concept often during my Weekly Livestreams here on Tradingview. You may also follow my last few years of Bitcoin price action analysis in the links below to see how we got here. Trade wisely!
