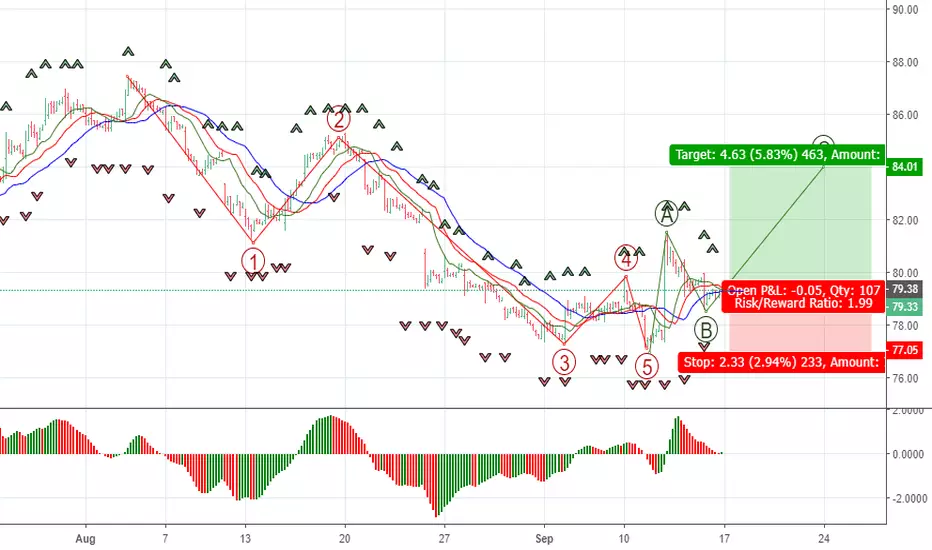
Philip Morris shares: expecting wave C upOn the hourly chart of PM shares, the price, most likely, has finished a corrective B wave within ABC zigzag. Expecting C wave or a new bullish cycle.
A-shares
Sirius Minerals gapped through 200 EMA (bearish), but...On the daily chart: SXX gapped down through its 200 EMA, a bearish sign
BUT found support at 23.5 on it's weekly 200 EMA
Stochastic on daily chart is trending down and could result in another decline
Also filling the gap at 31.72 could trigger fresh round of selling.
Let's see what happens.

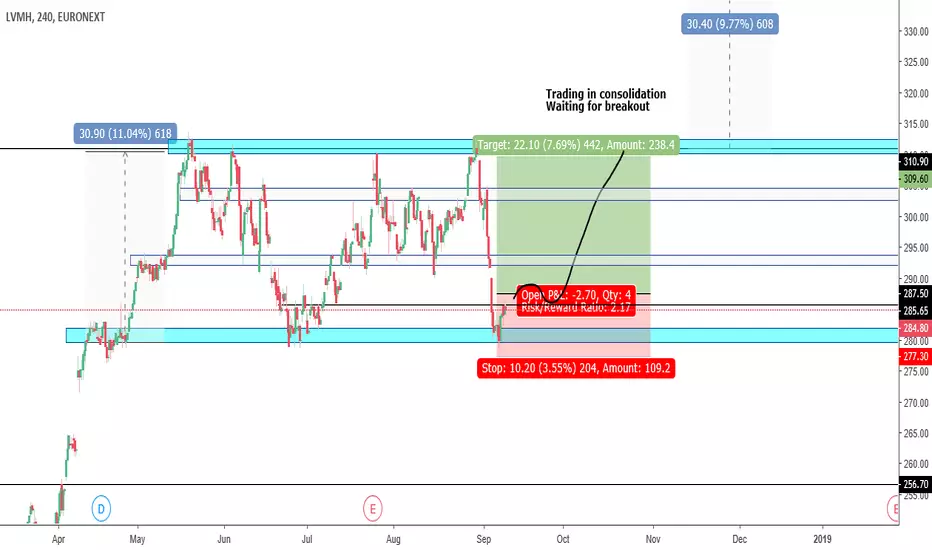
LVMH MC LongTraded within the light blue consolidation.
Reached the support that has proven its self on several occasions
Bull leg coming
Buying Disney sharesAt the daily chart of DIS shares, the price has formed a bullish divergent bar signal withing a possible end of wave 4. Buying at the breakout of the high level of the signal bar.

JD.COM in trouble if you care about head and Shoulders
For me JD.com will be a nice furture investment to battle Alibaba and Amazon, but by now they just don't make any profits and the chart tells the same story.
Buying opportunity at around 20 $ for a long run up.
Just my opinion so make your own research
and like always
May the markets be with us

#Centrica - 2 consecutive H&S patterns. Interpret that!No amount of technical analysis can interpret Centrica's
consecutive Head and Shoulder patterns.

Facebook FB LONGlong term: ascending triangle
Short term: price is still held in a triangle formation. a break on the downside seems more attainable.
scenario 1: break lower
sell after retset of 71.8 into support below
look for buy confirmations around the support region
scenario 2: break above
I would wait for a retest of of triangle
long till first target (once achieved reduce position size)

More for Hurricane Energy after breakout and retest?Classic breakout in April and retest in late May at 42p
Now on the way back up, but how much more?

Breakout for John Laing #JLGBreakout after good results.
Bullish.
NB: Posted early in the trading day, so there could be downward movement as the day progresses.

Breakout on $MACFBullish after a breakout of 70p resistance,
which has been in place since March 2016.

A2M - A2 Milk Company [Bulish Flag Setup]A2M looks set for a continuation off its bullish flag pattern, finding support at the 200 MA.
Blue sky above if it breaks through the top of the range / Will look for near-term support if it breaks through the bottom of the range
Note as the company is trading at a high PE, failing to meet forecasts/targets can have a significant impact on share price.

Is Albert Technologies about to break higher?ALB might break higher after breaking 35p,
retesting and now possibly moving higher.
Wait and see.

Long Adidas above area 180-190 with targert 200-210-225-260Long Adidas above area 180-190 with targert 200-210-225-260

Filtronic's looking bearish after bull trap last OctIn October 2017, it looked as if Filtronic was going to breakout of its range.
That wasn't the case, and now it appears to be bearish
with another test of 9.13

Mitie is breaking out after a false startMitie is breaking out after a false start
Broken the 50 EMA and is heading toward the 200 EMA
No trend reversal yet though.

CVS Bounced Nicely Off Support, Potential To Rise Further! CVS bounced off its support at 63.28 (76.4% Fibonacci retracement, 100% Fibonacci extension x2, multiple swing low support) where it could potentially rise up to its resistance at 67.58 (61.8% Fibonacci extension, 61.8% Fibonacci retracement, horizontal swing high resistance).
Stochastic (89, 5, 3) bounced off its support at 3.6% where a corresponding rise could occur.

BIDU Testing Support, Potential Bounce! BIDU is testing its support at 227.04 (100% Fibonacci extension x2, 78.6% & 76.4% Fibonacci retracement, horizontal overlap support) where it could potentially bounce up from here to its resistance at 248.58 (61.8% Fibonacci extension, 50% & 38.2% Fibonacci retracement, horizontal overlap resistance).
Stochastic (89, 5, 3) is approaching its support at 2.9% where a corresponding bounce could occur.

Blackstone Group Approaching Support, Potential Bounce!BX is approaching its support at 34.61 (100% Fibonacci extension, 38.2% Fibonacci retracement, horizontal overlap support) where it could potentially bounce off from and to its resistance at 36.30 (61.8% Fibonacci extension, horizontal swing high resistance).
Stochastic (89, 5, 3) is approaching its support at 5% where a corresponding bounce could occur.

Most holders at $NIPT are now underwaterNegative court judgement
has amplified the downtrend
which began in April 2015
It also broke below the 7.42 support.

$FB shares are testing the long-term uptrendFacebook shares are testing the long-term uptrend support on a weekly chart. The key level is on test.

Will Aortech break out?2 tests of 66 so far and it's above the 200 EMA.
Bollinger bands say should go higher, but
can it break resistance?

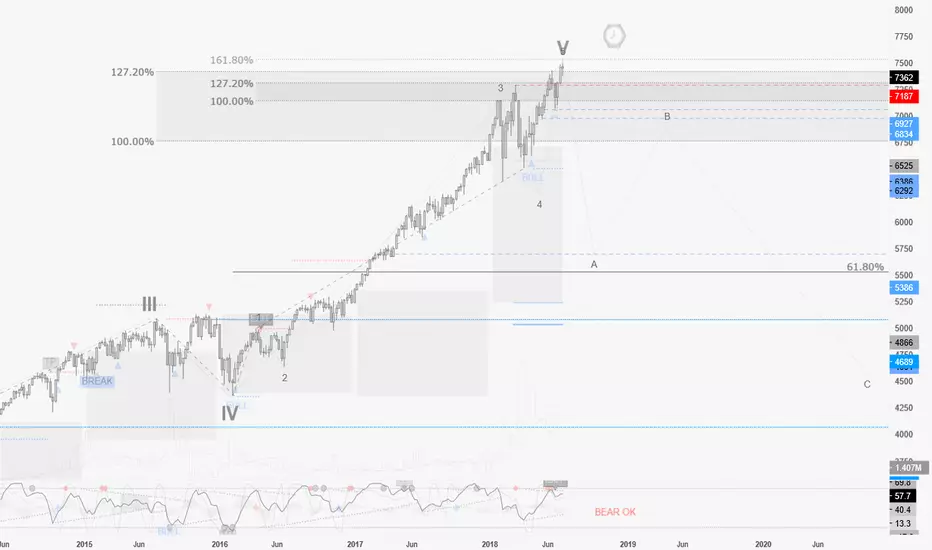
Buying HPE sharesOn the daily chart of HPE shares, the price has changed the trend direction into a bullish one after AO divergence. In my opinion, the instrument is at the beginning of the 5th Elliott wave of a bullish cycle, which gives more strength for a future growth if the price breaks the signal level in a form of the latest fractal

NAS100 / W : EXIT on Momentum, waiting for Sinewave confirmationHope this idea will inspire some of you !
Don't forget to hit the like/follow button if you feel like this post deserves it ;)
That's the best way to support me and help pushing this content to other users.
If you want to see my chart more closely, click the share button below that video.. You will be able to have access to the chart used in that video.
Indicators used in this forecast are PRO Sinewave BETA & PRO Momentum .
You can check my indicators via my TradingView's Profile : @PRO_Indicators
If you have questions about the topics discussed in that video post a comment with "@PRO_Indicators" handle.
Kindly,
Phil
If you want to learn more about the basic rules to trade with my indicators here's the educational video link :