$ULVR - Good results invalidates 3 year+ H&S top. Today's results look like they will invalidate the H&S top which started forming in early 2017.
A-shares


XPeng negative picture could still be attractive to investorsXPeng Inc. (symbol ‘XPEV’) share price has been trading in a slight bearish momentum for the last 3 months without any signs of bullish reversal. The company’s earnings report for the fiscal quarter ending December 2022 is set to be released on Friday 17th of March, before market open. The consensus EPS for Q4 is $-0,05 compared to Q4 2022’s $-0,24.
‘The share is trading at its all time low since the day of joining the New York Stock Exchange in September of 2020 after losing more than 80% of its valuation in 2022. The profit and loss statement is not looking good with the company recording net losses for the last 4 years and resulting in negative P/E and PEG ratios. The company’s share is undervalued by more than 45% which despite the negative financials it might still be considered an attractive investment option for long term investors since it has the potential to grow and possibly reach its all time high of more than $70 in 2020.’ said Antreas Themistokleous at Exness. ‘Xpeng (XPEV) will join the Hang Seng TECH Index, according to the company on March 7. The company is also expected to join the Hang Seng China Enterprises Index by mid-month, replacing China Feihe.’
From the technical analysis perspective the price has been trading in a declining trading channel in the last 3 months and is currently between the 50 and 100 moving averages , also known as “dynamic area”. The $10 area is a strong resistance since it consists of the 50% of the Fibonacci , the 50 day moving average and also the psychological resistance of the round number.
A continuation to the downside could find some support around $$8,90 which is the 61.8% of the Fibonacci and also an inside support area since late January.

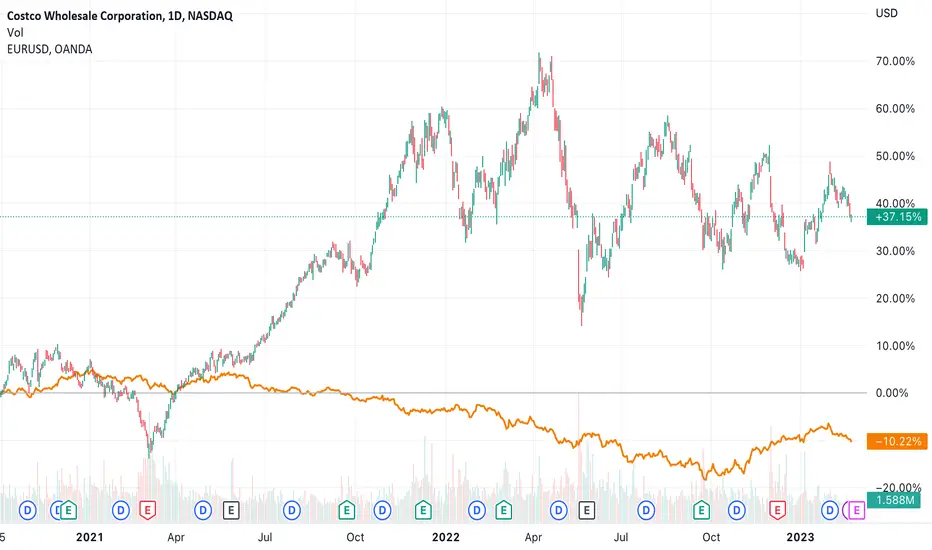
Costco price trading in a technical formation
Shares in Costco Wholesale Corporation (symbol ‘COST’) have gone through a very turbulent year with the share price ranging from high $610 to low $405. The company’s earnings report for the fiscal quarter ending February 2023 is set to be released on Thursday 2nd of March, after market close. The consensus EPS for Q1 is $3,21 compared to Q1 2022’s $2,92.
‘Costco generated just 2% of its revenue from membership fees, however, those $4.2 billion in membership fees accounted for most of its $7.8 billion in operating profits. This clever “formula” of generating revenue with a very high profit margin has helped the company get through a hard year.’ said Antreas Themistokleous, an analyst at Exness.
On the technical side the price has been trading in a descending triangle formation for the last 6 months. Currently the price is facing resistance at a point on the chart where is the crossing of the 20 day simple moving average line with the 50% of the daily Fibonacci retracement level. Given that there will be no big surprise percentage on the EPS at the date of the release the price most probably will continue to trade within the boundaries of the triangle formation in the short term.
In the case of upward movement ( supported also by the oversold levels on the Stochastic oscillator) we might see some resistance around the $520 price area which consists of the upper band of the Bollinger bands and the 61.8% of the Fibonacci, whereas in the case of a downward continuation the first point of support would probably be found around the $490 area which is made up of the 50 & 100 moving averages, the lower band of Bollinger bands and is also just below the 38.2% of the Fibonacci.
EUR/NZD SHORTMy ide today EUR/NZD Short
........................................
.........................................

AAPL STOCK BEARISH OUTLOOKNASDAQ:AAPL
HI , TRADER'S .. As you can see in chart That price did breaout from Channel down
Price Now reached 4HR Order Block or resistance level
market Can retrace back to 139$ to retest Channel down upper trendline
Sell Entry Is active Until Target Level
❤️Please, support my work with follow ,share and like, thank you!❤️

Boohoo longPossible double bottom formed.
Wait for confirmation before going in.
What are your thoughts?

Hartshead Resources is ready to push higherHartshead Resources (HHR) looking good...holding higher lows and I expect that a break above 0.043 will be bullish and drag in more buyers for a run higher.

SPXWe are waiting for the closing of wave A for the correction, the rise again, and the big drop after completing the correction

VIX in DIAMOND BUTTOMS!!!!!On the VIX Volatility index , I have observed a diamond pattern, which suggests that the current instability in market sentiment is likely to lead to a rise in market prices. Based on this, I decided to open a long position at the entry price of USD 21.21. I have set the Stop Loss level at USD 19.53 so that if market prices turn worse than expected, I can close the position with minimal loss. And I set the Take Profit at USD 24.26 so that if the market prices reach a certain level, I can automatically close the position at the best possible price. It is important to note that this is only my own observation and does not constitute investment advice. Everyone should make decisions in the financial markets at their own risk.

Shares - ASX200 - Westpac WBC Descending Triangle SHORTASX 200 - Westpac descending triangle breakout. High probably pattern. Target is set at 21.60. STO is low so entry price between 22.60 and 22.90. Expect levels around the 20.60 level as a take profit.
Volume: pretty low showing lack of support.
RSI: The new low has been confirmed by a new RSI low of 34.
STO: STO is low so it may be possible to enter a little higher just below 23.
Current Price: 22.63
Target 1: 21.60
Stop Loss: 23.90

IRFC (Indian Railway Finance Corporation) Stock Analysis Fundamentals:
Indian Railway Finance Corporation (IRFC) is a wholly owned subsidiary of the Indian Railways. It raises financial resources for expansion and running through capital markets and other borrowings.
IRFC started borrowing from the market in 1987–88.
Indian Railway Finance Corp (NS:INID) (IRFC) was set up on 12th December 1986 as the dedicated financing arm of the Indian Railways for mobilizing funds from domestic as well as overseas Capital Markets. IRFC is a Schedule ‘A’ Public Sector Enterprise under the administrative control of the Ministry of Railways, Govt. of India. It is also registered as Systemically Important Non–Deposit taking Non-Banking Financial Company (NBFC – ND-SI) and Infrastructure Finance Company (NBFC- IFC) with Reserve Bank of India (RBI). The Company’s principal business, therefore, is to borrow funds from the financial markets to finance the acquisition/creation of assets which are then leased out to the Indian Railways.
IRFC has funded the acquisition of 8998 locomotives, 47910 passenger coaches, 214456 wagons, which constitute around 70% of the total rolling stock fleet of Indian Railways. The Company has been assigned the additional task of funding Railway Projects through Institutional Finance to the extent of Rs.1.50 Lakh Crore by 2019-20. IRFC has also been lending to various entities in the Railway sector like Rail Vikas Nigam Limited (RVNL), Railtel, Konkan Railway Corporation Limited (KRCL), Pipavav (NS:RELV) Railway Corporation Limited (PRCL) etc.
For IRFC, the Government of India has remained the largest client, and that will remain so at least for the next 8-10 years because of the execution of the National Rail Plan, under which the government aims to spend 10-lakh crore to augment rail capacities and improve the infrastructure around it. The finance arm of the Indian Railways, Indian Railway Finance Corporation (IRFC) is in talks with the National High-Speed Rail Corporation Ltd (NHSRCL) to finance the extended portion of the Ahmedabad-Mumbai High-Speed Rail Project.
Indian Railway Finance Corporation (IRFC) reported a 15 per cent increase in net profit for the third quarter ended December 31. For the nine months period ended December 31, IRFC reported a 15.65 per cent increase in net profit. IRFC is trading at a price of INR 23.90.
This is a dividend-paying company.
IRFC raises money through financial bonds and from banks and financial institutions.
The company announced its initial public offering on January 18, 2021 and got listed on the National Stock Exchange of India / Bombay Stock Exchange on January 29, 2021.
we believe that as soon as the Covid-19 Pandemics Comes Down and the markets reopen where as the Governments starts its pending Projects the IRFC has a very good chance of price appreciations as the corporation has lots of Projects to Do. so does the funds and capitals flows in its balance sheets and overall activities will bring the higher intrinsic value to its shares.
Technical Analysis:
There Seems to be a Pegged zone exist at the price of 20Rs where the Scrip is pegged and The Script Driver Manipulating the Price not to fall bellow it as it leads to Merging and Acquiring the Government entity.
we can see the price has started its Bullish Trend From the 20.9RS and there are few Resistance on its bullish path.
there are total of 3 Targets defined by Fibonacci Extension levels where we can see the Share has a very high Potential of appreciations.

Triangle Pattern BreakoutEnergy index is preparing for a triangle pattern breakout, keep energy stocks in radar.

HMX ready to run into new highsHMX on the ASX is shaping up really nicely as price action holds a higher low and drags in more buyers. It may be only a matter of when not if bulls will charge up through 12 cents. With great prospects and news flow, I expect a solid move up.


DBS rallies ahead of tomorrow's earnings reportThe stock has been performing well ahead of its earnings reports, thanks to the news that DBS will be the bank to utilise MaxxDigital – a digital asset platform that provides risk and FX solutions for institutions. Whilst Singapore’s regulators continue to clamp down on crypto trading for retailers, Singapore wants to become a digital-asset hub within the financial sector – and this could be the first step of many which help them do just that.
DBS rose 3.6% on Friday following the announcement and has extended those gains to around 6% at the time of writing from Friday’s low.
According to Reuters, 13 analysts recommend DBS stock for a ‘buy’ (4 of which are a strong buy) with 4 holds and no sell recommendations. The stock currently trades at 34.58 and has a median price target of 39.11 (+13%).
DBS Daily Chart:
The daily chart shows that DBS performed a strong breakout (with high volume) from its sideways range after prices found support at the 200-day and 50-day EMA’s. And that suggests it could be part of the bullish trend from the July low. However, there are a couple of warning signs that it may need to retrace a little before continuing higher.
A bearish pinbar formed on Monday with low volume, and yesterday’s price action struggling to convincingly push higher. Gap resistance, $35 and the monthly R1 pivot point are nearby and RSI (2) is overbought - which can indicate a near-term turning point. With that said, the RSI(14) is over 50 and trending higher with prices, which is another reason we suspect any move lower is part of a retracement before prices head for the high around 36.30.
Of course, earnings can be full of surprises and we may need to see DBS beat estimates for it to trade directly higher. Otherwise – assuming earnings is not too disappointing – it could help with a desired pullback, where we would seek bullish setups around the monthly pivot / prior breakout range.

AAPL +$33 in 13 Weeks?This Apple weekly chart could be set for a move from $138-$171 by late January/early February, for a $33 gain.

Gold sell order open Hello Traders, here is the full analysis for this pair, let me know in the comment section below if you have any questions, the entry will be taken only if all rules of the strategies will be satisfied. I suggest you keep this pair on your watchlist and see if the rules of your strategy are satisfied.
XAUUSD Sell 1620 $ price most chance is down our 1st target is 1607 and next target is 1590 Dollar

KPITECH STOCK Breakout on Daily time frame with huge volumeKPITECH Stock: Breakout happens at daily time frame with High Volume
CMP:664.95
Target: It can go up to 740 to 760 level
Stop Loss at 590
We can go for a buy once retest or buy conservatively
Disclaimer :this is only my analysis as per my knowledge. this is not a call.
Please do your own analysis before taking any trade or ask your financial advisor.
Thanks

✅NAS100 WILL GO DOWN|SHORT🔥
✅NAS100 broke the key structure level
While trading in an downtrend
Which makes me bearish
And I think that after the retest of the broken level is complete
A rebound and bearish continuation will follow
SHORT🔥
✅Like and subscribe to never miss a new idea!✅

HPL ELECTRIC POWER. POSITIONAL VIEWNSE:HPL
My positional view for target of Rs.91 Risk and Reward is more than 1:2
Note: This is my personal analysis. For learners only.

When to up your share size?Many traders have 2 or more trade set ups.
It is important to know the following:
1)The risk of your trade must be in accordance with the winning percentage of the trade set up.
1)Your share size should increase or decrease in accordance with the winning percentage of the trade set up.
* Share size increase must be in accordance to you account size (account management)
These concepts are what separates really good traders from average traders.

China A50 Index - STRONG BUYHi Guys,
2823.hk which is the A shares ETF of China listed in Hong Kong is currently at a major support which it has been holding since 2016.
Also, it tested its 0.8 fib, broke previous high and now retraced back to 0.8 of the smaller wave. Classic PA.
I am bullish on China A Shares and believe that price target should be north of $18.
Buy at 14.84.
