AAL Bearish inclined Naked Calls 14 Jan Expiry (Jan Track 2)Whats The Plan/Trade/Thought
AAL was one of the shortlisted companies from the shortlisted sectors that did not recover after the Omicron news and the Feb Interest Rate decisions. Their prices stayed below the Omicron gap. Further more with the increasing infections rates countries are getting more cautious and this will impact the sentiment of travel
I Feel
I do feel good about my bearish ranging stance especially for Travel. What surprises me is that while the other travel related counters are declining. AAL on the 20 Dec just locked a positive price move.
Imagine Yourself Taking The Other Side
Imagine Yourself Taking The Other Side
Imagine Yourself As A Neutral Observer
Trade has been thought through and AAL was a shortlisted sector. Happy with it’s entry
Look For New Information
No new information
How Do I Feel Now
One day after my entry had AAL moving up while most Travel companies fell. I’m abit confused. But I think I have this feeling of anxiousness from my tough early Dec. It really was a terrible trading period.
Trade specs
Sold 400 Calls @ 0.22 - Strike 20
% to Strike 17%
ATR % is around 97% (High)
BP used 68k
Max Gain: est $8.8k
AAL

AAL, 15 minAmerican Airline Group, AAL 15 min
Buy @ 16.83 - 16.84
Sell at Target 1 : 16.96, Target 2: 17.03
Stop Loss @ 16.78
--------
DISCLAIMER:
I am not a financial /investment advisor. All information i am sharing here is for entertainment purposes only and should not be considered personal investment advice. While the information provided is accurate, it may include errors or inaccuracies. Please, do your diligence when it comes to investing or trading in the market. You are responsible on your choice. Thank you

Is this the beginning of the long waited move?Although "almost" every single sector moved ATH's, the travel stocks are still at their lows. I have been keeping eye on CCL AAL BA for their long waited move. Looking at the daily chart:
1. Made the first higher low
2. Stayed above the 0.236 Fib line
3. RSI 14 crossed RSI 50
Looking CCL to move to the 0.382 Fib line and hoping it will either:
1. Stay above
2. Make a higher high and create a bullish trend.
PS. This is not a financial advise nor I am a financial advisor.

American Airlines Analysis 06.12.2021Hello Traders,
welcome to this free and educational analysis.
I am going to explain where I think this asset is going to go over the next few days and weeks and where I would look for trading opportunities.
If you have any questions or suggestions which asset I should analyse tomorrow, please leave a comment below.
If you enjoyed this analysis, I would definitely appreciate it, if you smash that like button and maybe consider following my channel.
Thank you for watching and I will see you tomorrow!

AAL BuyI'm looking at a potential buy on AAL with two potential entries. This is following my strategy requirements and this company is a very good long-term hold, in my opinion, if you get in at a discounted price it will be worth it as long as you sell before the potential market crash. This stock should go back up as vaccination rates climb, so it should be decently safe for a long-term hold if you decide to do that. You can also look at this for the short term and treat it as a day trade because it should just continue ranging until it breaks up higher (if the market agrees with my analysis.) I'm simply going to enter when I see proper price action, if I can get something like a bullish engulfing pattern to show me confluence with my entry then ill go for the trade. If not I might just leave this thing alone. This is just my opinion and idea for a stock, and this is not financial advice. Let me know what you think and let's see what happens with the trade tomorrow.

Long | AALNASDAQ:AAL
strong buy
Possible Scenario: LONG
Evidence: Price Action , Dark pool activity, Options flow.
TP1: 20.35$
entry point: 19.89
Call options 12/17/21 strike 22$
Call options 11/19/21 strike 20$
*This is my idea and could be wrong 100%.

AAL with good opportunity for a long positionThe trigger was done. Possible going up for next days or weeks.

My AAL IdeaHello again,
You know I like to keep things simple
I just trade on Price Action.
Airline stocks are still risky but it's worth a shot here.
As you can see 19-20$ is holding as support.
For me that's a buying opportunity.
Below 18.30 I would cut it
I'm going for a HH here so $30-31 would be my target

low risk entry!Entry: 19.35
Stop loss: 18.93
Reward/Risk: 6.36
Target range: 22
Time Frame: 4 wks
Possible gain: 13.18%
Possible loss:2.17 %
Position size: 5% of trading capital
You can see the most important support (green lines) and resistance (red lines) to watch in the coming days in these charts!
Best,
Moshkelgosha
DISCLAIMER
I’m not a certified financial planner/advisor, a certified financial analyst, an economist, a CPA, an accountant, or a lawyer. I’m not a finance professional through formal education. The contents on this site are for informational purposes only and do not constitute financial, accounting, or legal advice. I can’t promise that the information shared on my posts is appropriate for you or anyone else. By using this site, you agree to hold me harmless from any ramifications, financial or otherwise, that occur to you as a result of acting on information found on this site.

Airlines have buyers at these prices!Looking at the trading volume you can see all Major airlines traded with above the average volume at these prices!
I think in the next 4-6 weeks they have the potential to gain +10%!
You can see the most important support (green lines) and resistance (red lines) to watch in the coming days in these charts!
Best,
Moshkelgosha
DISCLAIMER
I’m not a certified financial planner/advisor, a certified financial analyst, an economist, a CPA, an accountant, or a lawyer. I’m not a finance professional through formal education. The contents on this site are for informational purposes only and do not constitute financial, accounting, or legal advice. I can’t promise that the information shared on my posts is appropriate for you or anyone else. By using this site, you agree to hold me harmless from any ramifications, financial or otherwise, that occur to you as a result of acting on information found on this site.

Swinging AAL OptionsMonthly Swing Trade For AAL, entry, exit, and profit potential are noted in the bubbles

AAL $20 Calls December expAAL bouncing the bottom of this trendline. Could see some upside movement right in time for the holiday season!
Entry: $19.50

Trading Plan on AAL | What we are expecting Today, we will take a look at American Airlines Group from a technical perspective.
The main aspect we can observe is the weekly trendline working as dynamic support since 2008. We can consider it a major level from where we have observed lasting bullish impulses in the past.
Alright, if that's our support level to start thinking in bullish opportunities, we need to make sure that minor levels have also been broken. In this case, we have a descending trendline that started in 2018. The price broke it in March this year.
After the breakout, the price has been consolidating on a range from March 2021 until the current date.
The trading plan here is about waiting for the breakout of the current structure (yellow lines). IF that happens, we will be waiting for a small correction on the daily chart, and we will execute orders on the new local high.
Targets: On the weekly chart, we can see a major resistance zone around 56. However, we are not using that target because we may get stuck in long corrections. That's why we will use a minor resistance zone at 44.00
R/R ratio = 4.
Risk on the stop loss = 3%
Expected duration: 200 days
The main idea of defining a situation in advance is that we already know how to trade IF we observe these conditions; otherwise, we will not be trading (you have more than 1000 charts to keep looking for premium opportunities)
Thanks for reading! Feel free to add your charts and ideas, on the comment's box

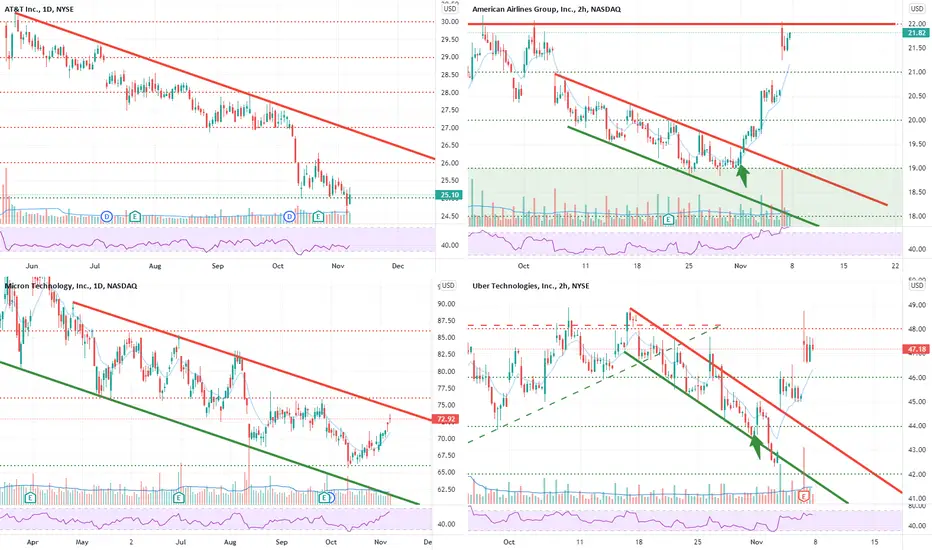
$UPWK $AAL $MU $UBER I OptionsSwing WatchlistUPWK 1W I UPWK massive ascending triangle on the weekly chart. After reporting earnings it came down to test our trend and this seems like a great entry to go long.
MU 1D I Micron is uniquely positions to speed up 5G across all parts of the spectrum. MU is currently breaking out from the bull flag we highlighted last week.
AAL 4H I AAL is showing us another entry to go long here. Setting a stop below $19.50. Looks like $20 will hold and it would be great to start seeing higher lows.
UBER 2H I UBER retested the breakout from the bullflag and it is now making a double bottom near $43. We have resistance near $46 and $48, and support near $44.

Airlines landing once again!On November 1st, 2021 I published an analysis for major Airlines, they experienced a +10% gain and start landing again!
And then I perfectly call the resistance:
they could become a long opportunity near their support lines!
You can see the most important support (green lines) and resistance (red lines) to watch in the coming days in these charts!
Best,
Moshkelgosha
DISCLAIMER
I’m not a certified financial planner/advisor, a certified financial analyst, an economist, a CPA, an accountant, or a lawyer. I’m not a finance professional through formal education. The contents on this site are for informational purposes only and do not constitute financial, accounting, or legal advice. I can’t promise that the information shared on my posts is appropriate for you or anyone else. By using this site, you agree to hold me harmless from any ramifications, financial or otherwise, that occur to you as a result of acting on information found on this site.


AAL to the downsideSector rotation with travel + having trouble breaking $22 yet again. Possible gap fill to the downside.

Long American AirlinesDecreasing Covid restrictions and the bullish gap let me think there could be an outbreak to the next resistance line4

$T $AAL $MU $UBER I OptionsSwing WatchlistT 1D I T spent millions lobbying to get the infrastructure bill passed. It's network expansion plans will benefit from govt. subsidies. There is a bullish div on the RSI.
AAL 2H I AAL ended up breaking from our bull flag last week and made a 15%+ move from our entry, after finding support near $19. Expecting resistance on AAL near $22.
MU 1D I Micron is uniquely positions to speed up 5G across all parts of the spectrum. MU is currently testing the top of its bull flag. The stock average price target is $96.
UBER 2H I BUBER bounced right on our trend. After reporting earnings UBER ended up breaking out from the bull flag and making a 12%+ move from our entry.
Airlines have just find their supports!Most airlines' stocks reacted to their support level and some of them have just broken above the downward trend line..!
It seems Delta and United could perform better than others if there is a relief rally..!
A relief rally is a respite from a broader market sell-off that results in temporarily higher securities prices. Relief rallies often occur when anticipated negative news winds up being positive or less severe than expected. (Investopedia)
Best,
Moshkelgosha
DISCLAIMER
I’m not a certified financial planner/advisor nor a certified financial analyst nor an economist nor a CPA nor an accountant nor a lawyer. I’m not a finance professional through formal education. The contents on this site are for informational purposes only and do not constitute financial, accounting, or legal advice. I can’t promise that the information shared on my posts is appropriate for you or anyone else. By using this site, you agree to hold me harmless from any ramifications, financial or otherwise, that occur to you as a result of acting on information found on this site.

$CRWD $AAL $AFRM $UBER I OptionsSwing WatchlistCRWD 4H I CRWD has been consolidating between $280-$290 after a big run from $240s. Watching for a breakout above ATH as we have uoa betting on a breakout above.
AAL 2H I Down nearly 15% from recent highs, we are seeing AAL trading within a bull flag pattern. We also have a bullish divergence forming on the RS on the 2H time frame.
AFRM 2H I Watching AFRM for a break above ATH. Even though we have a bearish divergence on the RSI, our ALGO picked up bullish activity on AFRM for 11/05.
UBER 2H I Down 10% from recent highs, we now have UBER trading within a bull flag. Watching for a bounce near $42 or a breakout from the bull flag pattern.

#AAL interesting low range level reached www.tradingview.com
NASDAQ:AAL
-Great low level of range support reached again
-Cross 200MA & 50MA
-Consistent great momentum in short direction
-Stock to watch next week

Post 10/21Q3 FY21' Earnings Analysis$AAL, $LUV, $BCS, $BX, $CMG, $INTC, $SAP, $SNAP, $T, $VLO
$AAL - American Airlines - posted better-than-expected revenue numbers, although down (25%) from Q3 of 2019 - shares were up +1.3% at the ended of the day, with this being their smallest quarterly loss since the pandemic
$BX - Blackstone - earnings nearly doubled YoY - reported an ATH of distributable earnings, success that’s largely driven by their focus on investing in high-growth areas of the economy
$T - AT&T - fell slightly after posting big subscriber gains -investors questioning the impact of promotions on the company’s future growth
$CMG - Chipotle Mexican Grill - reported better-than-expected EPS and revenue numbers - including a sales jump of 22% citing higher menu prices as a reason for the offset of rising costs
$SNAP - Snapchat - Snap fell (22%) after Q3 revenue missed estimates - thanks to its advertising business being disrupted by Apple privacy changes introduced earlier this year
