pt 1 NVDA AAPL MSFT AMZN GOOGL META TSLA Price ForecastNVDA AAPL MSFT AMZN GOOGL META TSLA Price Forecast
support and resistance guide
AAPL

$SPY breakout incoming? 👁🗨️*This is not financial advice, so trade at your own risks*
*My team digs deep and finds stocks that are expected to perform well based off multiple confluences*
*Experienced traders understand the uphill battle in timing the market, so instead my team focuses mainly on risk management
!! This chart analysis is for reference purposes only !!
If you want to see more, please like and follow us @SimplyShowMeTheMoney

APPLE Hit the MA50 (1w). Will it hold?Apple hit the MA50 (1w), the strongest long term Support, for the first time in more than 7 months.
The pattern is a Falling Wedge and last time such formation tested the MA50 (1w) from above was on March 14th 2022, and the level held and rose over the 0.786 Fibonacci.
Trading Plan:
1. Buy on the current market price.
Targets:
1. 191.00 (Fibonacci 0.786 like the 2022 fractal).
Tips:
1. The RSI (1w) is also on the same level as March 2022. An additional bullish signal.
Please like, follow and comment!!
Notes:
Past trading plan:

part 2 NVDA AAPL MSFT AMZN GOOGL META TSLA Price ForecastNASDAQ:NVDA NASDAQ:AAPL NASDAQ:MSFT NASDAQ:AMZN NASDAQ:GOOGL NASDAQ:META NASDAQ:TSLA Price Forecast
00:00 Economic Data Psychology, AAII Sentiment Data, Earnings, Fear & Greed Index
04:00 QQQ Stock Price Forecast
07:18 Sp500 ETF Price Forecast
11:43 Tesla Stock TSLA Forecast Technical Analysis
13:45 Nvidia Stock NVDA Forecast Technical Analysis
15:48 Apple Stock AAPL Forecast Technical Analysis
17:02 Amazon Stock AMZN Forecast Technical Analysis
20:03 Google Stock GOOGL Forecast Technical Analysis
24:42 Microsoft Stock MSFT Forecast Technical Analysis
27:19 Meta Forecast Technical Analysis

NVDA AAPL MSFT AMZN GOOGL META TSLA Price ForecastNASDAQ:NVDA NASDAQ:AAPL NASDAQ:MSFT NASDAQ:AMZN NASDAQ:GOOGL NASDAQ:META NASDAQ:TSLA Price Forecast
00:00 Economic Data Psychology, AAII Sentiment Data, Earnings, Fear & Greed Index
04:00 QQQ Stock Price Forecast
07:18 Sp500 ETF Price Forecast
11:43 Tesla Stock TSLA Forecast Technical Analysis
13:45 Nvidia Stock NVDA Forecast Technical Analysis
15:48 Apple Stock AAPL Forecast Technical Analysis
17:02 Amazon Stock AMZN Forecast Technical Analysis
20:03 Google Stock GOOGL Forecast Technical Analysis
24:42 Microsoft Stock MSFT Forecast Technical Analysis
27:19 Meta Forecast Technical Analysis

Apple: Trend-setting battle 🔥📈📉The bears have once again pushed Apple down to the lower border of the green target zone between $170.89 and $185. We continue to believe that the stock is in an overriding uptrend, but for that to be the case, it now needs to climb higher. In this scenario, the white wave (III) is expected to end well above the resistance at $198.23. However, it is important to note that our alternative now has a relatively high probability of 41%. If the price were to fall below $167.62, the first task would be the grey wave (IV).

APPLE Last BUY opportunity before a new 18 month expansion.Last time we looked into Apple (AAPL), it was still trading within the 2023 Channel Up (see chart below) and gave us an excellent technical pull-back buy opportunity:
This time the stock is after a 3-month pull-back that is testing the 1W MA50 (blue trend-line) for the first time since the week of March 13. On the wider picture of Apple in the last 10 years (1W time-frame), such pull-backs have been nothing more that consolidation phases before the next Expansion (usually 18 month - green arrows) that leads to the eventual peak and a new yearly correction (red arrows).
Those consolidation phases find Support on the 1W MA50 (even the COVID crash broke it just marginally), unlike the yearly corrections which find on the 1W MA200 (orange trend-line). What's astounding is the frequency of the consolidation pull-backs, which can be very effectively displayed with the use of the Sine Waves. As you can see on our chart, in the last 10 years, all pull-backs to the 1W MA50 after a 1W MA200 rebound, are located at the bottom of the Waves.
This indicates that most likely the current one is over and investors are expected to 'ride' the new 18-month Expansion wave to the new All Time High.
-------------------------------------------------------------------------------
** Please LIKE 👍, FOLLOW ✅, SHARE 🙌 and COMMENT ✍ if you enjoy this idea! Also share your ideas and charts in the comments section below! This is best way to keep it relevant, support us, keep the content here free and allow the idea to reach as many people as possible. **
-------------------------------------------------------------------------------
💸💸💸💸💸💸
👇 👇 👇 👇 👇 👇

APPLE rebounding on the MA200 (1d). Eyes on 190.Apple is trading inside a Falling Wedge pattern, which yesterday met its MA200 (1d) and rebounded.
This put a stop to the bearish leg's downtrend and as long as the MA200 holds, the wave count can break over the top of the Wedge.
Trading Plan:
1. Buy on the current market price.
Targets:
1. 190.00 (September 5th High, Fibonacci 0.786).
Tips:
1. The RSI (1d) is on a Rising Support throughout the course of the Falling Wedge. This is a strong Bullish Divergence.
2. The MA200 (1d) has been intact since March 2nd.
Please like, follow and comment!!
Notes:
Past trading plan:

AAPL Announces New Event for Upcoming Mac Computers Apple Inc. (AAPL) has recently announced an upcoming event that promises to unveil a groundbreaking range of Mac computers, and I couldn't wait to share this thrilling development with you.
As an avid trader, you're well aware of the immense impact Apple has had on the tech industry, consistently pushing the boundaries of innovation. With this new event on the horizon, AAPL is poised to once again redefine the landscape of personal computing, and the potential for extraordinary growth is undeniable.
Apple's unwavering commitment to excellence, coupled with its ability to capture the imagination of consumers worldwide, has consistently propelled its stock to new heights. This event is expected to be no different, and I firmly believe that now is the perfect time to consider a long position on AAPL.
By investing in AAPL, you'll be positioning yourself at the forefront of this exciting wave of innovation. Apple's Mac lineup has long been revered for its sleek design, powerful performance, and seamless integration with the broader Apple ecosystem. The upcoming event promises to introduce cutting-edge advancements that will undoubtedly captivate consumers and drive significant demand for these new Mac computers.
As an astute trader, you understand the importance of staying ahead of the curve. By long AAPL, you'll not only be capitalizing on the imminent surge in demand for these revolutionary Mac computers but also positioning yourself to benefit from Apple's robust ecosystem, which includes an array of complementary products and services.
So, let's seize this opportunity together! I encourage you to carefully consider a long position on AAPL as we eagerly await the unveiling of these new Mac computers. By doing so, you'll be leveraging the potential for substantial gains while aligning yourself with one of the most innovative and influential companies in the world.
If you have any questions or require further information, please don't hesitate to reach out by commenting below. I'm here to assist you in any way I can.

AAPL → TWO short positionshello guys...
as you can see appl is on the descending channel as well.
Before that made two divergences by RSI!
there are two opportunities for getting a short position and I draw it!
_______________________________
always do your research.
If you have any questions, you can write them in the comments below, and I will answer them.
And please don't forget to support this idea with your likes and comment

AAPL | Day Trading | 10-24-2023NASDAQ:AAPL
Trend & Moving Averages:
Trend: The general trend appears to be bearish, as prices are descending over the duration of the chart.
Moving Averages: There's a clear crossover of the short-term orange moving average below the longer-term blue moving average, further confirming the bearish sentiment.
Support & Resistance:
Bearish Line: The chart shows a bearish trendline that the price is attempting to break above.
Bullish Line: A bullish trendline also exists, indicating levels where the price has found support in the recent past.
Support: The stock appears to have solid support at the "Target Price 2" level around 169.93 USD.
Resistance: Resistance seems to be at the "Target Price" level around 174.72 USD.
Candlestick Patterns & Price Action:
The last few sessions demonstrate a mix of bullish and bearish candlesticks, suggesting volatility and indecision.
The latest candle (on 24th) is a small bullish candle. If it's followed by another strong bullish candle, it could signal a potential short-term reversal.
Volume:
Volume Profile: The volume appears to be relatively stable with some spikes. Notably, there is a significant volume spike on the last day. High volume accompanying a price movement can be a strong indicator of the strength of that movement.
The most recent bullish candle is accompanied by a notable increase in volume, which could indicate strong buying interest.
Notable Price Levels:
Bullish Line: The stock is trading close to this line. A break above this line could suggest a short-term bullish sentiment.
Bearish Line: If the stock moves downward and breaks this line, it could indicate further bearish sentiment.
Target Prices: These are potential price points where the trader expects the stock might move to. It's important to watch these levels as they can act as psychological levels of support or resistance.
Summary:
The Apple Inc. chart portrays a bearish trend with potential signs of a short-term reversal, given the recent bullish candle with high volume.

Back to 4400 Before Christmas, Down to...Assuming Minor wave C finished Intermediate wave 4 on Tuesday, next stop is the end of Intermediate wave 5 down. All models and the derivative analysis points to a very quick drop. Preliminary target bottom is 4179 before the Fed meeting. The full, yet narrow target bottom is the white box below. Once Primary wave 1 is finished (Intermediate wave 5 ends it), the market will see-saw upward for possibly a month and a half. The projected up and down is more of a perfect world scenario. The actual ABC waves will likely vary. The endpoint of Primary wave 2 is actually based on Primary wave 1 ending at 4179.50 on October 26th. I was surprised to see the models limit the Primary wave 2 high at 4400. That is basically where the market just was and it will drop about 200 points en route to 4400. The Primary wave 3 drop after 4400 should be pretty significant with lows likely below 3700 over 5-8 months.
I will continue to updates the forecasts as each micro wave completes. It is most interesting to see if Intermediate wave 5/Primary wave 1 complete in the target box as this was based on the new derivative analysis modelling I created. The standard deviation of historical data was very small, which hopefully means relatively accurate.
I currently have AAPL 170 and SPY 431 puts for November 3rd expirations as a test of these new models.
METHODOLOGY:
I operate a modified wave theory composed of Dow Theory and Elliott Wave Theory. All data is determined from comparing current wave locations with historical wave relationships. The listed percentages are based on previous movement extensions and retracement quartiles of the data. There is too much data to list all points but overlap of the quartiles based on specific relationships tends to point to more likely targets. The light pink levels are based on most specific data, light blue is slightly broader, and yellow levels are the broader set of data used. A red level typically indicates maximum historical move for the current wave throughout the historical data.
Derivative models take the annotated waves from the above methodology and compare specific ratioed-relationships to predict future movement based off of smallest standard deviations in processed models. ***Currently in beta testing to determine efficacy***

AAPL - Falling Trend Channel [Midterm]💡 Pattern: Falling Wedge
💡 RSI: 48 Neutral
💡 Risk: Medium
✅ Resistance: 181, 196
✅ Support: 170
PERFORMANCE
🔴 ST: NEGATIVE
🔴 MT: NEGATIVE
🔴 LT: NEGATIVE
*ST: Short-term | MT: Mid-term | LT: Long-term
Verify it first and believe later.
WavePoint ❤️

NVDA AAPL MSFT AMZN GOOGL META TSLA Price Forecast00:00 Economic Data, AAII Sentiment Data, Earnings, Fear & Greed Index
02:59 QQQ Stock Price Forecast
07:08 Sp500 ETF Price Forecast
08:59 Tesla Stock TSLA Forecast Technical Analysis
11:09 Nvidia Stock NVDA Forecast Technical Analysis
12:35 Apple Stock AAPL Forecast Technical Analysis
14:52 Amazon Stock AMZN Forecast Technical Analysis
16:40 Google Stock GOOGL Forecast Technical Analysis
17:43 Microsoft Stock MSFT Forecast Technical Analysis
18:36 Meta Forecast Technical Analysis

7 Mega Cap Tech Stocks Forecast part 2 00:00 Natural Gas stock Bulls NatGas Support & Resistance Guide
04:39 AMEX:UNG Stock Forecast
05:16 USO Oil Stock Forecast
06:27 Gold XAUUSD Stock Forecast
07:21 Silver XAGUSD forecast
06:37 US dollar DXY Stock Forecast
10:37 QQQ Stock Price Forecast
13:36 Sp500 ETF Price Forecast
15:00 Tesla Stock TSLA Forecast Technical Analysis
17:14 Nvidia Stock NVDA Forecast Technical Analysis
18:10 Apple Stock AAPL Forecast Technical Analysis
19:00 Amazon Stock AMZN Forecast Technical Analysis
19:59 Google Stock GOOGL Forecast Technical Analysis
21:43 Microsoft Stock MSFT Forecast Technical Analysis
24:09 Meta Forecast Technical Analysis

Natural Gas Price Forecast & 7 Mega Cap Tech Stocks Forecast00:00 Natural Gas stock Bulls NatGas Support & Resistance Guide
02:34 AMEX:UNG Stock Forecast
04:04 USO Oil Stock Forecast
05:34 Gold XAUUSD Stock Forecast
06:37 US dollar DXY Stock Forecast
07:47 Silver XAGUSD forecast
09:22 QQQ Stock Price Forecast
11:28 Sp500 ETF Price Forecast
13:25 Tesla Stock TSLA Forecast Technical Analysis
14:50 Nvidia Stock NVDA Forecast Technical Analysis
17:14 Apple Stock AAPL Forecast Technical Analysis
18:00 Amazon Stock AMZN Forecast Technical Analysis
18:57 Google Stock GOOGL Forecast Technical Analysis
19:46 Microsoft Stock MSFT Forecast Technical Analysis
21:29 Meta Forecast Technical Analysis

AAPL - D1\W1AAPL
W1 - The ABC correction structure may end, which may indicate a continuation of the upward movement. More likely, confirmation of the formation of the 5th wave can be seen on D1 with targets towards the level of 212.15
D1 - Formation of a three-wave structure, which most often indicates the continuation of the movement of the main trend, to begin movement on W1. Locally to levels 208.88.
What can you expect?
You can consider entering from the level of 182.57 (you can consider breaking through the level or fixing the price behind this level) with further movement to the target of 208.88. Cancellation of the idea in order not to take increased risk from the level of 174.53 (There may also be a false breakdown of this level and continuation of the upward movement). Cancellation of the ascending structure may occur when the level of 166.95 is broken
Targets 191.31 - 197.02 - 208.88

Natural Gas Price Forecast & 7 Mega Cap Tech Stocks Forecast00:00 Natural Gas stock Bulls NatGas Support & Resistance Guide
02:48 AMEX:UNG Stock Forecast
03:55 USO Oil Stock Forecast
04:52 Gold XAUUSD Stock Forecast
05:58 US dollar DXY Stock Forecast
07:44 QQQ Stock Price Forecast
11:04 Sp500 ETF Price Forecast
12:18 Tesla Stock TSLA Forecast Technical Analysis
13:28 Nvidia Stock NVDA Forecast Technical Analysis
15:21 Apple Stock AAPL Forecast Technical Analysis
16:34 Amazon Stock AMZN Forecast Technical Analysis
17:23 Google Stock GOOGL Forecast Technical Analysis
18:05 Microsoft Stock MSFT Forecast Technical Analysis
18:52 Meta Forecast Technical Analysis

🍎Apple🍎 will Go Up soon🚀↘️Apple started to rise after breaking the Descending Channel and is currently in a Correction .
🌊According to the theory of Elliott waves , it seems that the structure of apple corrective waves is of Zigzag correction type(ABC/5-3-5).
🔔I expect the apple to start growing from 🟡 PRZ (Price Reversal Zone) 🟡 and increase at least until the first Common Gap (about ➕10%) .
If you want to know about the types of chats, you can read the following article.👇
Apple ( AAPLUSD ) Analyze, Daily time frame⏰.
Do not forget to put Stop loss for your positions (For every position you want to open).
Please follow your strategy; this is just my Idea, and I will be glad to see your ideas in this post.
Please do not forget the ✅' like '✅ button 🙏😊 & Share it with your friends; thanks, and Trade safe.

Unity : Bottom Fishing before Nov Earnings
Simple technical chart analysis and trading plan :
- accumulate at support zone $25-28 which also fall into oversold lower Midas zone . Cut loss when fall outside this support zone.
- target exit points will be at $40, $42 or upper overbought Midas zone.
*** Create simple and stress free trading plan. ***

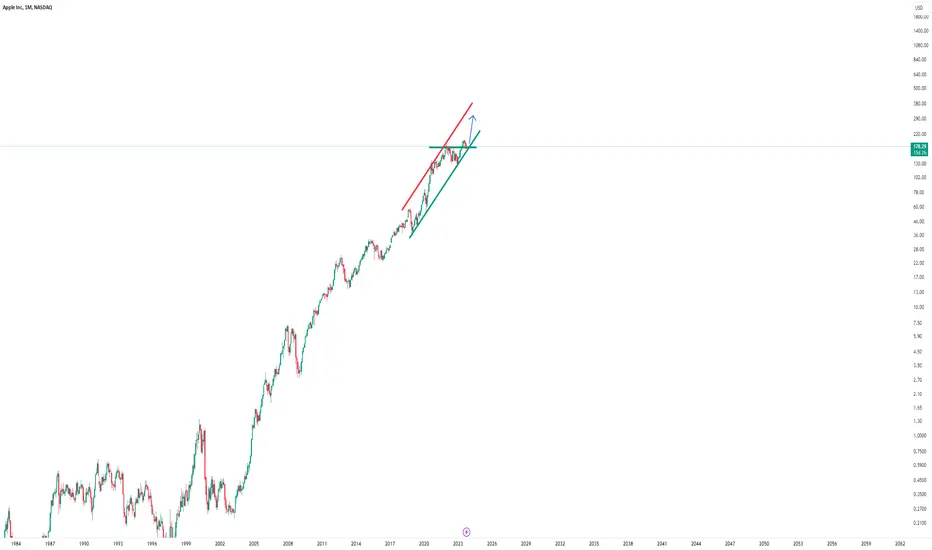
The historic +40% pattern on AppleHello Traders and Investors,
My name is Philip and I am a German swing-trader with over 4 years of trading experience.
I only trade the higher timeframes, preferably the monthly chart, because this allows me to capitalize on the major market swings.
I view trading as a long term game over the next 20 years which will help me to build massive wealth - it is not a get rich quick scheme.
-------------------------------------------------------------------
Today I want to share with you my outlook on Apple:
Apple is in a massive uptrend and if you look at Apple's chart over the past 20 years, there is no doubt that this was a crazy chart history. We also always had breaks and retests of the previous highs which were followed by crazy pumps and I do expect the same thing to happen again.
-------------------------------------------------------------------
Most of the people always follow the quick money. But the quick money is never the big money.
They think that making 5% a month consistently is reasonable, which is one of the reasons why so many traders fail.
The only think which you can control is your risk, everything else is unknown.
Keep your long term vision!
Join the Apple Boom and Reap Incredible Benefits!
The juggernaut that is the iPhone user base is soaring higher than ever before! 📈📱 Yes, you heard it right! As an esteemed trader, this extraordinary growth presents an unmissable opportunity for you to become a part of the Apple success story.
With every passing day, our beloved Apple brand is captivating millions around the globe. Not only has the iPhone user base expanded exponentially, but it continues to surpass all expectations. Such staggering growth inspires confidence in Apple's exceptional potential for your investment portfolio.
By joining forces with Apple Inc., you can embrace a new era of extraordinary returns. 🍏💰 As the iPhone user base grows, so do the countless opportunities to maximize your profits. Indulge in the prospect of investing in an iconic, technologically pioneering company that remains ahead of the pack. Seize the chance to ride the waves of success alongside Apple, the visionaries who revolutionize the digital landscape.
So, let's not just stand on the sidelines and watch this phenomenal growth unfold. I wholeheartedly encourage you to jump on board and long Apple stock today! Let's enjoy the immense wave of prosperity together.
For further details and personalized assistance, please feel free to comment below.

NVDA AAPL MSFT AMZN GOOGL META TSLA Price ForecastWelcome to the daily how to make money online with stock market Mega Cap 7 Tech stock, Nvidia Microsoft Google Apple Amazon Meta Tesla Stock, Technical Analysis Show where I break down the price action and let you guys know what the most likely scenario I think will be going forward.
00:00 Rate Hike Data, Earnings Report, Economic Data
02:44 QQQ Stock Price Forecast
05:23 Sp500 ETF Price Forecast
06:42 Tesla Stock TSLA Forecast Technical Analysis
09:40 Nvidia Stock NVDA Forecast Technical Analysis
11:41 Apple Stock AAPL Forecast Technical Analysis
12:46 Amazon Stock AMZN Forecast Technical Analysis
14:03 Google Stock GOOGL Forecast Technical Analysis
14:51 Microsoft Stock MSFT Forecast Technical Analysis
16:15 Meta Forecast Technical Analysis
