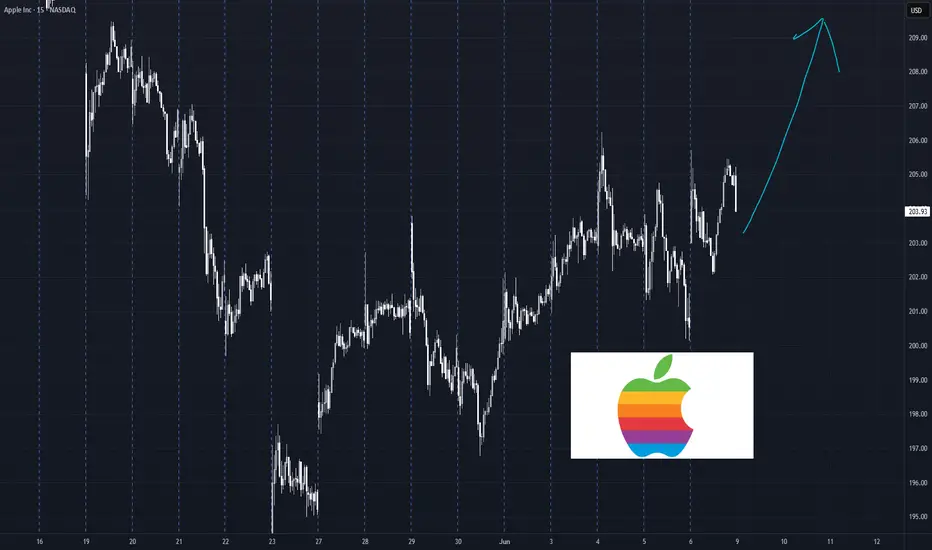
APPLE: 3 year Channel Up targets $285.Apple is marginally bearish on its 1D technical outlook (RSI = 43.788, MACD = -0.260, ADX = 30.978) as the recent weakness impeded the price from making the decisive bullish break-out above it. The 1W RSI structure though indicates that this is a bottom formation and it is evident on the Channel Up that the April 7th low has been the start of the new bullish wave. The first bullish wave which also started after a -32% correction, made a first peak on the 1.236 Fibonacci extension. We are bullish on Apple long term, TP = 285.00.
## If you like our free content follow our profile to get more daily ideas. ##
## Comments and likes are greatly appreciated. ##
AAPL

Apple Stock Drops: Is Slow AI Development to Blame?The tech world was abuzz on Monday as Apple, a titan of industry and a beacon of innovation, experienced a sudden and significant dip in its stock value, shedding approximately $75 billion in market capitalization. This abrupt decline sent ripples through the investment community, prompting a closer examination of the underlying factors contributing to what many perceive as a rare moment of vulnerability for the Cupertino giant. While market fluctuations are a normal part of the financial landscape, this particular downturn has been widely attributed to growing investor apprehension regarding Apple's perceived slow progress in the burgeoning field of generative artificial intelligence (AI). In an era where competitors are aggressively pushing the boundaries of AI capabilities, Apple's more measured approach appears to be raising questions about its future competitive edge and its ability to maintain its unparalleled ecosystem.
The $75 Billion Question: Unpacking Apple's Stock Drop
Apple's stock drop on Monday was not an isolated incident but rather a culmination of mounting concerns among investors. While the immediate trigger for such a sharp decline can often be a specific news event or analyst downgrade, the broader context points to a deeper anxiety: the pace and direction of Apple's generative AI development. For a company that has historically set the pace in consumer technology, a perception of lagging in a critical emerging technology like generative AI is a significant red flag for the market.
The $75 billion loss in market value represents a substantial sum, even for a company of Apple's immense size. It signifies that a considerable portion of investor confidence, particularly concerning future growth prospects, has been eroded. This erosion stems from the understanding that generative AI is not just another feature; it is poised to revolutionize how users interact with technology, from personal assistants to content creation and productivity tools. Companies that fail to innovate rapidly and effectively in this space risk being left behind, potentially losing market share and, more importantly, mindshare among consumers.
Investors are keenly aware that the tech landscape is unforgiving. Past leaders, even those with seemingly unassailable positions, have faltered when they failed to adapt to paradigm shifts. The market's reaction to Apple's AI progress, or lack thereof, is a testament to the perceived urgency and transformative potential of generative AI. It suggests that the market is valuing future AI capabilities heavily, and any perceived deficit in this area translates directly into a discounted valuation. The stock drop, therefore, serves as a stark reminder that even for Apple, continued dominance is not guaranteed without aggressive innovation in key technological frontiers.
Apple's Generative AI Journey: A Work in Progress
Apple's approach to AI has historically been characterized by a focus on integration, privacy, and user experience. Features like Siri, Face ID, and computational photography are all powered by sophisticated AI algorithms, seamlessly woven into the Apple ecosystem. However, these applications typically fall under the umbrella of discriminative AI, which is designed to make predictions or classifications based on input data. Generative AI, on the other hand, is about creating new content—text, images, audio, video—that is often indistinguishable from human-created output. This is where Apple's "work in progress" status becomes a point of contention.
For years, Apple has been quietly investing in AI research, acquiring smaller AI companies, and hiring top talent. Its chips, particularly the A-series and M-series, are designed with powerful Neural Engines specifically optimized for on-device AI processing. This emphasis on on-device AI aligns with Apple's core philosophy of privacy, allowing many AI computations to occur directly on the device without sending user data to the cloud. While this approach offers significant privacy benefits and can lead to faster, more responsive experiences, it may also present challenges in scaling the massive computational power required for large language models (LLMs) and other complex generative AI applications that often rely on vast cloud infrastructures.
The challenge for Apple lies in translating its existing AI prowess and privacy-centric philosophy into compelling generative AI experiences that can compete with the rapid advancements seen elsewhere. While there have been reports and rumors of Apple developing its own LLMs and generative AI tools, concrete product announcements or widespread public demonstrations have been notably absent. This silence, coupled with the aggressive public releases from competitors, has fueled the narrative that Apple is behind the curve. The market is looking for tangible evidence of Apple's generative AI capabilities, not just promises of future integration. The "work in progress" status, while a natural part of any complex technological development, is being scrutinized under a microscope, especially given the high stakes of the generative AI race.
The AI Race: Contrasting Apple with OpenAI, Google, and Microsoft
The generative AI landscape is currently dominated by a few key players who have made significant strides, setting a high bar for innovation and public perception. The contrast between these leaders and Apple's perceived pace is stark and forms the crux of investor concerns.
OpenAI, with its groundbreaking ChatGPT, DALL-E, and Sora models, has arguably ignited the current generative AI boom. Its strategy has been one of rapid iteration, public release, and collaborative development, often prioritizing innovation and accessibility over immediate commercialization. This approach has allowed OpenAI to capture significant public attention and demonstrate the immense potential of generative AI, effectively becoming the face of the movement.
Google, a long-standing leader in AI research, has been quick to integrate generative AI into its vast ecosystem. Its Gemini models are designed to be multimodal and highly capable, powering features across Google Search, Workspace, and Android. Google's advantage lies in its immense data reserves, vast computational infrastructure, and decades of AI expertise. While it initially faced criticism for being slow to respond to ChatGPT, Google has since demonstrated its commitment to integrating generative AI deeply into its core products and services, showcasing a comprehensive and aggressive strategy.
Microsoft, through its strategic partnership and substantial investment in OpenAI, has positioned itself as a formidable force in the generative AI space. By integrating OpenAI's models into its Azure cloud services, Microsoft 365 suite (Copilot), and Bing search engine, Microsoft has rapidly brought generative AI capabilities to millions of enterprise and consumer users. This partnership has allowed Microsoft to leverage cutting-edge AI research without having to build every component from scratch, accelerating its time to market and providing a significant competitive advantage.
In contrast, Apple has historically preferred to develop its core technologies in-house, maintaining tight control over its hardware and software integration. While this approach has resulted in highly optimized and secure products, it may be a slower path when it comes to rapidly evolving, data-intensive fields like generative AI. The lack of a public-facing, widely accessible generative AI product from Apple, akin to ChatGPT or Gemini, creates a perception that it is not participating in the same league as its rivals. This perception, whether entirely accurate or not, is what is currently impacting investor confidence and contributing to the stock's recent performance. The market is looking for Apple to demonstrate its unique value proposition in generative AI, beyond its traditional strengths.
Challenges and Implications for Apple
Apple's perceived lag in generative AI development presents several significant challenges and implications for its future.
Firstly, there's the risk of falling behind in core product experiences. As generative AI becomes increasingly integrated into operating systems, productivity suites, and creative tools, devices and platforms that lack these capabilities may appear less competitive. Imagine a future where intelligent agents seamlessly manage tasks, generate content, and provide hyper-personalized experiences. If Apple's ecosystem doesn't offer comparable features, it could erode its premium appeal and lead users to platforms that do.
Secondly, developer mindshare is crucial. The most innovative applications and services often gravitate towards platforms that offer the best tools and capabilities. If generative AI developers perceive Apple's platform as less capable or slower to adopt cutting-edge AI models, they might prioritize other ecosystems, potentially leading to a stagnation in the breadth and quality of third-party applications within the Apple App Store.
Thirdly, ecosystem lock-in, a traditional Apple strength, could be challenged. While Apple's integrated hardware and software create a powerful ecosystem, the allure of superior AI capabilities on other platforms could tempt users to switch. For instance, if Google's AI-powered features on Android become significantly more advanced and useful than what Apple offers on iOS, even loyal Apple users might consider alternatives.
Finally, there's the impact on brand perception and innovation narrative. Apple has built its brand on innovation and pushing technological boundaries. A perception of being a follower rather than a leader in a transformative technology like generative AI could tarnish this image, potentially affecting consumer loyalty and its ability to attract top talent in the long run. The $75 billion stock drop is a clear signal that the market is taking these implications seriously.
The Path Forward: Apple's Strategy to Reclaim AI Leadership
Despite the current concerns, it would be premature to count Apple out of the generative AI race. The company possesses immense resources, a vast user base, unparalleled brand loyalty, and a proven track record of entering established markets and redefining them. Apple's path forward in generative AI will likely involve several strategic moves.
One approach could be to leverage its existing hardware advantage. Apple's custom silicon, particularly the Neural Engine in its A-series and M-series chips, provides a powerful foundation for on-device AI. The company could double down on developing highly efficient, privacy-preserving generative AI models that run directly on its devices, offering unique capabilities that cloud-based solutions cannot match. This would align with its privacy-first philosophy and differentiate its offerings.
Secondly, strategic acquisitions and partnerships could accelerate its progress. While Apple prefers in-house development, the rapid pace of generative AI might necessitate acquiring specialized AI startups or forming partnerships with leading AI research labs to quickly integrate cutting-edge models and talent. This would allow Apple to bridge any perceived gaps more rapidly.
Thirdly, Apple might focus on integrating generative AI subtly and seamlessly into its existing products and services, rather than launching standalone, attention-grabbing AI models. This "Apple way" of introducing technology often involves refining and perfecting features before a public rollout, ensuring they are intuitive and enhance the user experience without being overtly complex. This could involve AI-powered enhancements to Siri, improved content creation tools in its creative suite, or more intelligent automation within iOS and macOS.
Finally, developer engagement will be crucial. Apple needs to provide robust tools and frameworks that empower developers to integrate generative AI capabilities into their apps, leveraging Apple's on-device AI power. This would foster a vibrant ecosystem of AI-powered applications that further enhance the value proposition of Apple devices.
In conclusion, Apple's recent stock drop serves as a potent reminder of the market's high expectations and the transformative power of generative AI. While the company's deliberate and privacy-focused approach to AI has its merits, the rapid advancements by competitors like OpenAI, Google, and Microsoft have created a perception of lag. The challenge for Apple is to demonstrate how its unique strengths—integrated hardware and software, a focus on user experience, and a commitment to privacy—can translate into a compelling and competitive generative AI strategy. The coming months will be critical as Apple navigates this pivotal technological shift, aiming to reassure investors and consumers that it remains at the forefront of innovation, ready to define the next era of personal computing with its own distinct AI vision.

Who likes Apple Crumble....WWDC Event FlopSome Key Areas:
Unified Design: Liquid Glass
- Apple unveiled a new design language called Liquid Glass, inspired by visionOS. This aesthetic introduces rounded, translucent elements across iOS 26, iPadOS 26, macOS 26 ("Tahoe"), watchOS 26, tvOS 26, and visionOS 26, aiming for a cohesive and modern look across all devices
Apple Intelligence & AI Enhancements
- Apple expanded its AI capabilities under the Apple Intelligence umbrella:
On-Device AI Models: Developers can now access Apple's on-device large language models to integrate AI features into their apps, ensuring privacy and efficiency.
- Genmoji: A new feature allowing users to create personalized emojis by merging existing ones.
- ChatGPT Integration: Siri can now delegate complex queries to ChatGPT, powered by GPT-4o, with user consent.
- Live Translation: Real-time translation is now available in Messages, FaceTime, and Phone apps, enhancing multilingual communication.
iOS 26 & iPadOS 26: Enhanced User Experience
- Redesigned Apps: Updated Camera, Safari, and Phone apps featuring the new Liquid Glass design.
iPadOS 26 brings
- Advanced Multitasking: Enhanced window management and a Mac-like Preview app.
macOS 26 ("Tahoe"): Productivity Focus
- Personalized Spotlight: Improved search functionality with AI-driven suggestions.
WatchOS 26 & AirPods Enhancements
- AI-Powered "Workout Buddy": Provides real-time insights and encouragement during fitness activities.
Gaming & Developer Tools
- Apple Gaming Hub: A new app aggregating games and challenges, enhancing the gaming experience across devices.
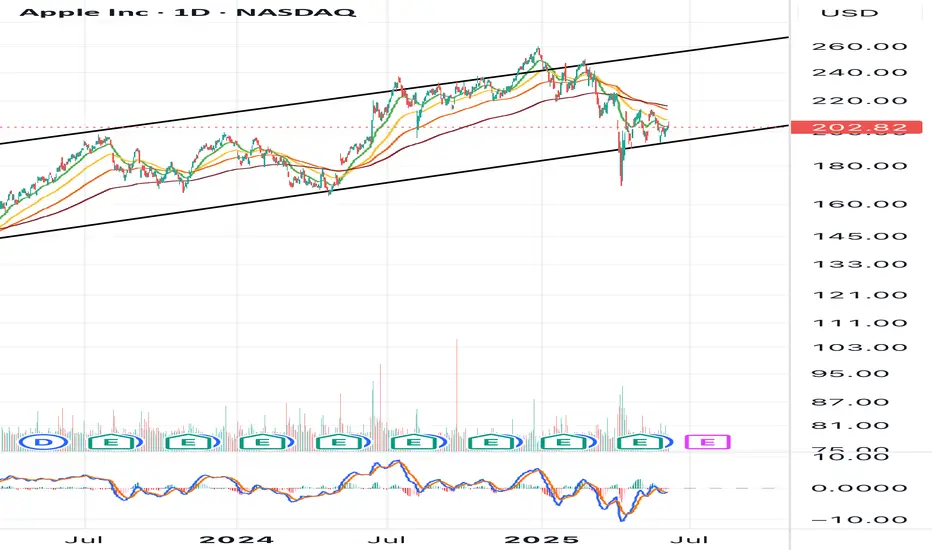
Apple is at a technical inflection point. It needs to hold the wedge or it runs the risk to going lower to the previous lower boundary range.

Apple (AAPL) Shares Consolidate Ahead of WWDCApple (AAPL) Shares Consolidate Ahead of WWDC
Today, 9 June, marks the start of Apple’s Worldwide Developers Conference (WWDC) — an event that traditionally attracts significant attention from investors and traders.
It is fair to say that WWDC 2025 begins against a rather negative backdrop:
→ Since the start of 2025, AAPL stock price has fallen by 19%, and Apple has lost its title as the world’s most valuable company, now trailing behind Microsoft and Nvidia.
→ Expectations raised by last year’s conference — particularly regarding new AI features in the iPhone — were not fully realised. As Barron’s noted, in March, an Apple spokesperson admitted that the new Siri “will take longer than we thought to implement these features. We expect to roll them out next year.”
Technical Analysis of the AAPL Chart
AAPL price movements are forming a narrowing triangle pattern:
→ The red trendline highlights sustained downward pressure on AAPL shares in 2025 — partly driven by concerns over the impact of the ongoing trade war;
→ On the other hand, the area below the psychological $200 level may attract buyers willing to take on risk.
WWDC 2025 could well provide fresh hope for the bulls and prompt an attempt to break out upwards from the triangle pattern.
This article represents the opinion of the Companies operating under the FXOpen brand only. It is not to be construed as an offer, solicitation, or recommendation with respect to products and services provided by the Companies operating under the FXOpen brand, nor is it to be considered financial advice.

$META Short Swing - Fractal Repeat Play - Sub $600 Target@everyone 🔻 META Short Swing – Fractal Repeat Play 🔁
Entry Trigger: Week of June 10, 2025
Ticker: NASDAQ:META
Current Price: $697.71
Target Price: $593.66
Estimated Duration: ~3–4 weeks
Conviction: ★★★★★
🧠 Thesis:
This is a nearly perfect fractal repeat of META’s July 2024 top:
Identical weekly candle structure: topping wick into fib + supply zone
Weekly gap fill target lines up exactly again — same 15.5% drop
Wick gap fill = $593.66 (same confluence from 2024)
Bearish fib roadmap from 0.786 → 0.618 → 0.382
Volume and momentum exhausted on the run into $702
📉 Trade Plan:
Entry Range: $690–702 rejection zone
Stop Loss: Weekly close above $705
Primary Target: $593.66
This level completes the wick gap fill and matches 2024’s exact structure
Secondary Target (optional): $580.84 (full fib gap + demand retest)
🛠️ Options to Consider:
6/28 $650P or $640P – standard swing
7/5 $620P – for deeper move toward 0.382 and beyond
🔍 Setup Snapshot:
July 2024: -15.56% in 28 days
June 2025: Targeting -15.53% in 28 days
Same gap, same wick rejection, same fade roadmap

Stock Market Forecast | TSLA NVDA AAPL AMZN META MSFTStock Market Forecast | CME_MINI:NQ1! CME_MINI:ES1! QQQ AMEX:SPY
Mag 7 Forecast | NASDAQ:TSLA NASDAQ:NVDA AAPL AMZN META MSFT GOOG

AAPL Swing Trade Plan – 2025-06-06🍏 AAPL Swing Trade Plan – 2025-06-06
Bias: Moderately Bullish
Timeframe: 5–10 days
Catalyst: WWDC event, bullish short-term technicals, declining VIX
Trade Type: OTM call option with high R/R profile
🧠 Model Consensus Snapshot
Model Direction Strike Entry Price Profit Targets Stop Loss Confidence
Grok No Trade – – – – 50%
Claude Long $207.50 ~$2.04 $3.00 / $3.75 ~$1.40 72%
Llama Long $205.00 ~$2.87 +20% -50% 78%
Gemini Long $210.00 ~$1.45 $2.10 / $2.90 ~$0.72 75%
DeepSeek Long $215.00 $0.70 $1.05 / $1.40 $0.35 75%
✅ Majority View: Moderately Bullish
📉 Max Pain: $205 → Possible short-term magnet
📆 WWDC Event: Potential catalyst or risk depending on outcome
🧾 Sentiment: Positive, with a bullish skew on options OI
📈 Technical Overview
Short-term: Above 10-EMA on 15m and daily
Medium-term: Challenging 50-EMA (~$204.83)
Weekly: Mixed but improving MACD
VIX: Falling (<20), supportive of calls
Risk: Compression near $205 due to max pain, and event risk from WWDC
✅ Final Trade Setup
Parameter Value
Instrument AAPL
Direction CALL (LONG)
Strike 215.00
Expiry 2025-06-20
Entry Price $0.70
Profit Targets $1.05 (50%) / $1.40 (100%)
Stop Loss $0.35 (50%) or if AAPL closes < $203.33
Size 1 contract
Entry Timing At market open
Confidence 75%
📍 Rationale: Deep OTM offers low-cost exposure with strong potential R/R into an event week.
⚠️ Key Risks to Watch
Break below $203.33 → invalidate bullish thesis
WWDC disappointment → negative gamma risk
Max pain at $205 → short-term pinning risk
Theta decay → rapid loss if no momentum by mid-week
AAPL Short-Term Bearish Play – ATM Put into $200 Magnet Zone🍎 AAPL Short-Term Bearish Play – ATM Put into $200 Magnet Zone
🗓️ Date: June 6, 2025
⏳ Timeframe: 0DTE (intraday to EOD swing)
📉 Setup: Breakdown continuation with weak bounce potential
🔍 Model Summary Breakdown
Model Bias Strike Entry Target Stop Confidence
Grok 🔻 Bearish $200 put 0.83 1.25 0.60 68%
Claude 🔻 Bearish $200 put 0.83 1.25/1.66 0.50 68%
Llama 🔻 Bearish $200 put 0.83 1.25 $202.50↑ 65%
Gemini 🔻 Bearish $197.50 put 0.36 0.60/0.72 0.18 65%
DeepSeek 🔻 Bearish $200 put 0.83 1.25 0.42 70%
✅ Consensus Bias: Moderately Bearish
📊 Strike Favorite: $200 Put (high OI, max pain magnet)
⚖️ Sentiment Factors:
VIX stable
Heavy OI at $200 (puts > calls)
AAPL trading below all intraday EMAs
🧭 Technical Snapshot
Short-Term (5m / 15m): Price below 10/20-EMAs, bearish MACD
Daily: Momentum weakening, but not full reversal yet
Support/Resistance: $200 max pain zone = gravitational level
News Flow: Neutral — no major catalysts yet
✅ Recommended Trade Setup
Metric Value
Instrument AAPL
Direction PUT (Short)
Strike $200.00
Expiry 2025-06-06
Entry Price $0.83 (ask)
Profit Target $1.25 (≈50%)
Stop-Loss $0.60 (≈30%)
Position Size 1 contract
Confidence 68%
Entry Timing Market open
🎯 Rationale
📉 All models agree on bearish technicals across multiple timeframes
🧲 Max pain + heavy $200 OI acts as a price magnet into close
🔄 Risk/reward favors quick downside move if $200 breaks cleanly
⚠️ Risks to Monitor
⏳ Theta decay — 0DTE option requires fast movement
🔁 Oversold bounce near $200 support could reject breakdown
📈 Gap-up open above $201.50 would invalidate trade thesis
🔔 Low-vol environment may compress intraday moves

$AAPL new lows incoming?NASDAQ:AAPL doesn't look that great here. The rejection of $212.58 a couple weeks back left us with a double top at the highs.
Unless we can retake that level, I think more downside is likely.
I've marked off key support areas on the way down.
Let's see where we end up.

AAPL Ascending Price ChannelAAPL has been in ascending price channel since August 2020. At the start of April we saw a retest of support where it temporarily broke through, tested the 200 ema, bounced, then broke back above the previous support line. Since then it has retested support 3 separate times which is a strong indication that AAPL will continue to remain in this price channel for the foreseeable future.
The key is whether it can rise above 209.27
Hello, traders.
If you "Follow", you can always get new information quickly.
Have a nice day today.
-------------------------------------
(AAPL 1D chart)
In order to continue the uptrend in the medium to long term, the price needs to stay above the M-Signal indicator on the 1M chart.
The important support and resistance zones at the current price position are the 182.94-199.62 zone and the 226.67-240.55 zone.
In that sense, the key is whether it can support near the 182.94-199.62 zone and rise above 209.27 to maintain the price.
The 226.67-240.55 zone is expected to act as resistance, but if it breaks through upward, it is expected to renew the ATH.
The important support zone is the 131.59-138.79 zone. If it falls to this area and shows support as the trading volume increases, you should focus on finding a buying point.
-
The basic trading strategy is to buy on the HA-Low indicator and sell on the HA-High indicator.
This trading strategy is a trading method within the box range.
If it falls below the HA-Low indicator or rises above the HA-High indicator, you should create a trading strategy using the trend trading method.
Therefore, the basic trading method should be a split trading method.
The 215.44 point is the OBV Low indicator point on the 12M chart, and from a long-term perspective, it can be interpreted that an uptrend can begin only when it rises above 215.44.
Therefore, you can see that the 209.27-215.44 section is an important section for turning into an uptrend.
-
Thank you for reading to the end.
I hope you have a successful trade.
--------------------------------------------------

AAPL Bounce at 200 EMA- Remains in ascending channelAAPL has been in ascending price channel since August 2020. At the end of April we saw a retest of support where it temporarily broke through, tested the 200 ema, bounced, then broke back above the previous support line. I believe AAPL will remain in this channel and price will continue to rise with an eventual retest of resistance.

AAPL Weekly Options Outlook — June 3, 2025📈 AAPL Weekly Options Outlook — June 3, 2025
🚨 AI Model Consensus: Moderately Bullish into June 6 Expiry
🧠 Model Summary
🔹 Grok (xAI)
Bias: Moderately Bullish
Setup: Price above EMAs, MACD divergence softening; resistance at $203.40
Trade: Buy $207.50C @ $0.67 → PT $1.00, SL if AAPL < $202
Confidence: 65%
🔹 Claude (Anthropic)
Bias: Moderately Bullish
Setup: Bullish reversal, rising EMAs, MACD improving
Trade: Buy $207.50C @ $0.67 → PT $1.20–$1.80, SL $0.35
Confidence: 70%
🔹 Gemini (Google)
Bias: Moderately Bullish
Setup: Above EMAs, MACD histogram rising; resistance $203.46–$203.81
Trade: Buy $207.50C @ ~$0.65 → PT $0.97–$1.14, SL $0.32
Confidence: 65%
🔹 Llama (Meta)
Bias: Moderately Bullish
Setup: Above EMAs, MACD crossover building
Trade: Buy $207.50C @ $0.67 → PT $0.80, SL $0.335
Confidence: 70%
🔹 DeepSeek
Bias: Moderately Bearish
Setup: MACD still negative; resistance at $203.81
Trade: Buy $200P @ $0.93 → PT $1.86, SL $0.46
Confidence: 65%
✅ Consensus Highlights
🔼 Bullish Momentum on short-term EMAs
📉 Max Pain at $200 could limit upside by Friday
📊 Strong liquidity on both $207.50C and $200P
🔁 Most models plan to exit midweek; only DeepSeek expects a breakdown
🎯 Recommended Trade Setup
💡 Strategy: Bullish Single-Leg Weekly Call
🔘 Ticker: AAPL
📈 Direction: CALL
🎯 Strike: $207.50
💵 Entry: $0.67 (ask)
🎯 Profit Target: $1.17 (+75%)
🛑 Stop Loss: $0.34 (−50%)
📏 Size: 1 contract
📅 Expiry: 2025-06-06
⏰ Entry Timing: Market Open
📈 Confidence: 68%
⚠️ Risk Factors
📉 Max pain gravity could limit upside later in the week
🔼 Resistance zone at $207.50–$210 may stall momentum
⌛ Rapid theta decay — needs early move to profit
📰 Any negative macro or tech headlines could invalidate setup

$NASDAQ:AAPL - bEST AREAS TO lONG ANDA WAIT FOR RIGHT TIME !NASDAQ:AAPL
best areas to long and wait for right time!
best accumulation areas:
green areas = best support:

Stock Market Forecast | TSLA NVDA AAPL AMZN META MSFTStock Market Forecast | CME_MINI:NQ1! CME_MINI:ES1! SPY QQQ
Mag 7 Forecast | NASDAQ:TSLA NASDAQ:NVDA AAPL AMZN META MSFT GOOGL

AAPL 2025 Strategic Outlook: Overview of Primary CatalystsAfter trading around $200 intraday on May 27, Apple shares closed at $200.21—up 2.5% despite broad market headwinds and lingering investor skepticism.
Technical outlook remains bullish, as price action is still defined by
a rising bullish channel on higher time frames. expecting AAPL to bottom
out heading into Q3/Q4 2025 and then another bull run of 70-80%.
Here are the primary catalysts shaping Apple’s stock price in 2025, ranked 0–10:
AI integration and Apple Intelligence
Strength: 9/10
Rollout of on-device AI features (upgraded Siri, generative image tools, ChatGPT integration) expected to drive a renewed iPhone upgrade cycle.
Services segment growth
Strength: 8.5/10
App Store, Apple Music, iCloud and other services projected to grow double-digits, with new AI services adding billions in revenue.
Gross margin expansion and cost efficiencies
Strength: 8/10
Shift toward higher-margin services and anticipated memory price declines could boost overall gross margin by roughly 50 basis points.
iPhone 17 product cycle
Strength: 7.5/10
Rumored polymer battery improvements and possible foldable models may spur meaningful hardware upgrades versus Android peers.
Vision Pro and hardware diversification
Strength: 7/10
Mixed-reality headset upgrades under Apple Intelligence will broaden appeal, though high price and modest enterprise traction limit near-term impact.
Share buybacks and dividend policy
Strength: 7/10
A planned $100 billion buyback in 2025, plus steady dividends, underpins valuation, though recent pullbacks hint at caution amid cost headwinds.
Supply-chain diversification and trade policies
Strength: 6.5/10
Ongoing U.S.-China tensions and potential tariffs create uncertainty; pivoting assembly to India and Vietnam helps mitigate risk.
Regulatory and antitrust pressures
Strength: 6/10
New EU rules may force Apple to open parts of its ecosystem, potentially weighing on Services revenues.
Macro and interest-rate environment
Strength: 5/10
A “higher-for-longer” Fed rate outlook raises discount rates on growth, tempering valuations for tech leaders.
Smartphone market competition
Strength: 5/10
Samsung and fast-growing Chinese OEMs intensify price and feature competition, especially in emerging markets.
⭐️Catalyst Strength Rankings (May 2025)
✅AI integration and Apple Intelligence: 9
✅Services segment growth: 8.5
✅Gross margin expansion and cost efficiencies: 8
✅iPhone 17 product cycle: 7.5
✅Vision Pro and hardware diversification: 7
✅Share buybacks and dividend policy: 7
✅Supply-chain and trade policy risk: 6.5
✅Regulatory and antitrust pressures: 6
✅Macro and Fed policy: 5
✅Smartphone competition: 5

AAPL summer breakoutFriday 5/23, Tues 5/27, Wed 5/28 - bullish
Targets up to 225-230 maybe... not all this week (summer)
*looks like AAPL has already moved toward the 207-208 level overnight.
*hope we are blessed with a pullback to buy back up. 202-203
*NVDA earnings propping market = good
*Catalyst conversations mounting:
finance.yahoo.com

Apple - Please look at this chart!Apple - NASDAQ:AAPL - is just wonderful:
(click chart above to see the in depth analysis👆🏻)
Last month, Apple created a quite strong bullish rejection wick of about +25%. It was actually no surprise at all, because market structure was perfectly pushing price higher. Following the bullish break and retest pattern, new all time highs will most likely follow.
Levels to watch: $200, $300
Keep your long term vision!
Philip (BasicTrading)

$AAPL laggard to the upside?All of the tech stocks recently have had a large moves to the upside, yet Apple has yet to have one. I think Apple is lagging the other names and is likely to have the same kind of move to the upside.
I rarely trade short term, but this one seems like a good setup.
I took a trade for 6/6 $235C to express this view.
Let's see if it plays out.

TSLA New ATH incoming? Overview of primary catalysts.After trading between $346 and $365 intraday on May 27, Tesla shares closed at $362.89—up modestly despite broader market headwinds and lingering investor skepticism.
Here’s a detailed breakdown of the primary catalysts shaping Tesla’s stock price (ranked 0–10):
1. Electric Vehicle Demand Growth
Strength: 9/10
Global EV adoption remains the single largest driver of Tesla’s top line. Despite slowing sales in Europe and China, overall EV penetration continues to surge as consumers shift away from internal-combustion engines.
2. Launch of Affordable Model (Entry-Level EV)
Strength: 8.5/10
Elon Musk has reiterated plans to unveil a sub-$25,000 EV in early 2025, targeting the mass market. Investors cheered a recent reaffirmation of focus on core products over peripheral projects.
3. Battery Cost Reductions & Margin Expansion
Strength: 8/10
Tesla’s relentless drive to lower battery pack costs underpins both profitability and price competitiveness. Q4 cost of goods sold dipped below $35,000 per vehicle, even as margins softened amid mixed volumes.
4. Autonomy & Robotaxi Progress
Strength: 7.5/10
Commercial robotaxi trials are slated to begin in Austin in June 2025, with a dedicated Cybercab in development. While regulatory and safety hurdles loom, the promise of recurring software subscription revenue could be transformative.
5. Competition from Other EV Manufacturers
Strength: 7/10
Legacy automakers and startups alike are ramping up EV offerings. Tesla’s U.S. market share has declined in recent years, highlighting intensifying pressure in key regions.
6. U.S.–China Trade Policies & Tariffs
Strength: 6.5/10
Fluctuating tariffs on Chinese EV imports have led to order suspensions and forecasting challenges. Trade-policy uncertainty remains a wild card given Tesla’s global supply chain.
7. Regulatory Incentives & Subsidies
Strength: 6/10
U.S. federal tax credits under the Inflation Reduction Act and similar programs in Europe and China support EV demand—and Tesla’s eligibility criteria will influence its market growth.
8. Commodity Price Volatility (Lithium, Nickel, Cobalt)
Strength: 5.5/10
Raw material cost swings can erode margins. While long-term supply agreements help, spot shortages or price spikes remain risks.
9. Fed “Higher for Longer” Interest Rate Environment
Strength: 5/10
Elevated real yields reduce the appeal of high-growth names like Tesla. A sustained hawkish stance from the Fed could continue to cap valuations, similar to how it weighs on non-yielding assets.
10. Corporate Governance & Elon Musk’s Public Profile
Strength: 4/10
Musk’s high-profile engagements and occasional controversies can politicize the brand, prompting sentiment-driven stock swings.
Catalyst Strength Rankings (May 2025)
🔸 EV demand growth: 9
🔸 Affordable Model launch: 8.5
🔸 Battery cost & margins: 8
🔸 Autonomy/robotaxi progress: 7.5
🔸 Competition: 7
🔸 Trade & tariffs: 6.5
🔸 Regulatory incentives: 6
🔸 Commodity costs: 5.5
🔸 Fed rates: 5
🔸 Musk profile: 4
Analyst Forecasts for 2025
| Analyst / Consensus | 12-Month Price Target | Rating |
| --------------------------- | --------------------- | ------------ |
| High | \$470.00 | – |
| Median | \$306.00 | Hold/Neutral |
| Low | \$115.00 | – |
| Average (Consensus) | \$306.29 | Hold |
| Dan Ives (Wedbush) | \$315 | Outperform |
| Adam Jonas (Morgan Stanley) | \$430 | Overweight |
* Consensus sees a range of \$115–\$470 with an average near \$306.
* Dan Ives trimmed his target from \$550 to \$315, citing tariff risks and political headwinds.
* Adam Jonas remains bullish with a \$430 target, viewing Tesla as an “embodied AI compounder” despite near-term brand challenges.
Where to Next for Tesla?
* Current price: \~\$362.89
* Key support levels: \$350 and \$340
* Next technical floor: \$330
* Upside triggers: Stronger-than-expected delivery volumes, breakthrough in full-self-driving (FSD) reliability, or renewed cost cuts.
Tesla’s stock remains a balance between long-term disruptive potential and short-term execution risks. While EV adoption and autonomous ambitions underpin a compelling growth narrative, margin compression, competitive pressures, and macro uncertainties will dictate volatility in the months ahead.

AAPL Stock Trading Plan 2025-05-25AAPL Stock Trading Plan (2025-05-25)
Final Trading Decision
Models’ Key Points
DS Report
Technical: Strong bearish—price ($195.27) below all EMAs (10/50/200) on M30/daily/weekly; RSI oversold but in downtrend; bearish MACD; hugging lower Bollinger band. Sentiment: Rising VIX (22.29), negative tariff news, heavy institutional distribution. Trade: Short at $195.27; target $189.56; stop $197.50; 3–4 week hold; confidence 70%.
LM Report
Technical: Bearish price vs EMAs; RSI near oversold; Bollinger lower‐band touch hints at bounce; bearish MACD. Sentiment: Elevated VIX; negative headlines. Trade: No trade—mixed oversold/bearish signals; confidence 55% (below 60% threshold).
GK Report
Technical: Bearish across daily/weekly; RSI approaching oversold; MACD bearish but weakening; Bollinger lower‐band proximity. Sentiment: Rising VIX; tariff news headwind. Trade: Short at $195.00; target $189.56; stop $200.35; 4 week hold; confidence 65%.
GM Report
Technical: Multi‐timeframe bearish—price below EMAs M30/daily/weekly; RSI oversold short‐term; strong bearish MACD. Sentiment: VIX up; negative tariff/profit‐risk headlines; 5-day −7.6% drop. Trade: Short at $195.00; target $187.50; stop $198.90; 3–4 week hold; position sizing example 25 shares on $10k equity; confidence 85%.
CD Report
Technical: Bearish across timeframes; RSI oversold; lower Bollinger band; MACD bearish but showing early convergence. Sentiment: Elevated VIX; tariff threat. Trade: Short at $195.27; target $189.56 (secondary $185.00); stop $202.41; 3–4 week hold; confidence 72%. Agreement and Disagreement
Agreement
Broadly bearish technical setup: price below key EMAs; bearish MACD; lower‐band Bollinger action. Negative fundamental catalyst: potential tariffs and geopolitical risk. Rising VIX supports risk‐off bias. Recommendation skewed toward shorting AAPL shares.
Disagreement
LM sees too much mixed signal (oversold + bearish) to trade; all others recommend a short. Entry divergences: $195.00 vs. $195.27. Stop‐loss levels range from $197.50 up to $202.41. Take-profit levels range from $189.56 down to $185.00 (secondary) or $187.50. Confidence varies 65%–85%. Conclusion
Overall Market Direction Consensus: Strongly Bearish
Recommended Trade
Strategy: Short AAPL shares Holding Period: 3–4 weeks Entry Timing: At market open (~$195.00) Position Sizing: Risk 1% of trading capital (e.g., 25 shares on a $10 000 account; scale accordingly) Entry Price: 195.00 Stop‐Loss: 198.90 (≈2% above entry; sits above recent resistance) Take‐Profit: 187.50 (below key support for a ~3.8% move) Confidence Level: 85%
Key Risks and Considerations
Severe oversold conditions could trigger a technical bounce. AAPL’s strong balance sheet may limit downside if market stress eases. Tariff news or policy reversal could abruptly shift sentiment. Monitor VIX and major support at $189.56 for early signs of exhaustion.
TRADE_DETAILS (JSON Format) { "instrument": "AAPL", "direction": "short", "entry_price": 195.00, "stop_loss": 198.90, "take_profit": 187.50, "size": 25, "confidence": 0.85, "entry_timing": "open" }
📊 TRADE DETAILS 📊 🎯 Instrument: AAPL 📉 Direction: SHORT 💰 Entry Price: 195.0 🛑 Stop Loss: 198.9 🎯 Take Profit: 187.5 📊 Size: 25 💪 Confidence: 85% ⏰ Entry Timing: open
Disclaimer: This newsletter is not trading or investment advice but for general informational purposes only. This newsletter represents my personal opinions based on proprietary research which I am sharing publicly as my personal blog. Futures, stocks, and options trading of any kind involves a lot of risk. No guarantee of any profit whatsoever is made. In fact, you may lose everything you have. So be very careful. I guarantee no profit whatsoever, You assume the entire cost and risk of any trading or investing activities you choose to undertake. You are solely responsible for making your own investment decisions. Owners/authors of this newsletter, its representatives, its principals, its moderators, and its members, are NOT registered as securities broker-dealers or investment advisors either with the U.S. Securities and Exchange Commission, CFTC, or with any other securities/regulatory authority. Consult with a registered investment advisor, broker-dealer, and/or financial advisor. By reading and using this newsletter or any of my publications, you are agreeing to these terms. Any screenshots used here are courtesy of TradingView. I am just an end user with no affiliations with them. Information and quotes shared in this blog can be 100% wrong. Markets are risky and can go to 0 at any time. Furthermore, you will not share or copy any content in this blog as it is the authors' IP. By reading this blog, you accept these terms of conditions and acknowledge I am sharing this blog as my personal trading journal, nothing more.

Stock Market Forecast | TSLA NVDA AAPL AMZN META MSFT GOOGLStock Market Forecast | CME_MINI:NQ1! CME_MINI:ES1! SPY QQQ
Mag 7 Forecast | NASDAQ:TSLA NASDAQ:NVDA AAPL AMZN META MSFT GOOG

Apple losing $3Trillion clubNASDAQ:AAPL lost a fair amount of market share this week.
Coming under pressure from comments by Trump and tarrif news.
Apple seems to be a target for the president despite him answering a call on live TV today using an Iphone...kinda ironic.
Apple could easily chop in this 9% range before it makes a definitive move.
I lean more bullish since we're testing the lows of the trade range.
If Apple holds here it could be forming a right shoulder for a very bul,ish inverse head and shoulder pattern.
