APPLE INC/ Big bullish potential willing to reach the price 304-The market has a big bullish potential willing to reach the price 304.18 (our next Fibonacci level).
-Strong buy signal
Aaple

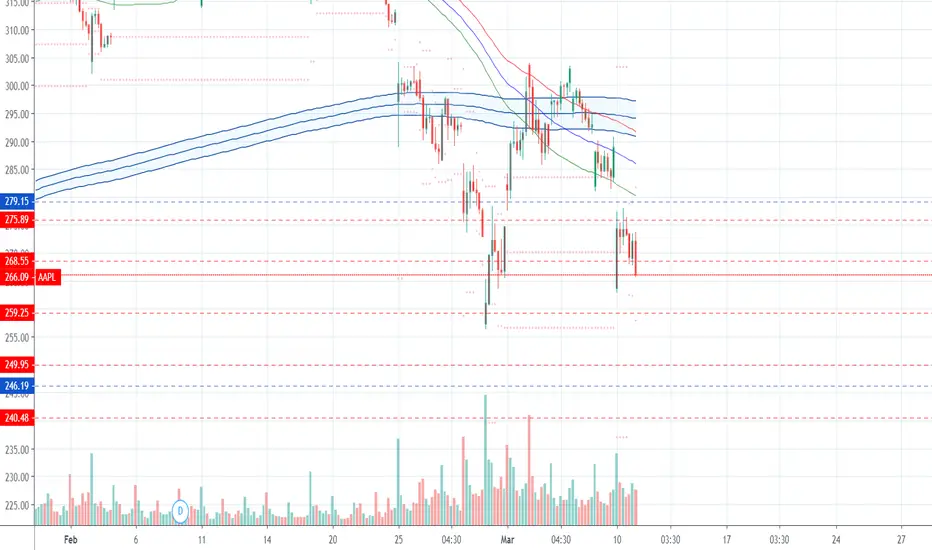
The Big Apple. (AAPL)Great time to be playing apple.
Levels drawn.
Potential breakout, play this price aggressive.
Watch volume.

#AAPL ANALYSIS.. NEVER SAY NEVER.. In my previous analysis, I mentioned that a strong sales wave could come to the markets again, in this context, I expect a structure as I mentioned in the chart.. Never say never.. Markets will be very interesting after 6 months, we will wait and see.. I firmly believe that big crash will come eventually and oil prices were the leading indicator of this..
Disclaimer: Please do your own due diligence when it comes to investing.. Never put in money that you cannot afford to lose.. Invest at your own risk..
I wish you all the best..

AAPL Primary Count, Better Dump Soon... As for indices, we better dump soon in big caps to maintain our primary counts alive.

AAPLE INC .. sellsell set up on H4 .. this is a trade that will take days to hit profit. Apply proper risk management and a proper trading strategy for entering and exiting the trade. Goodluck trading.

AAPL, APPLE stock going bullish in the next few days.Apple stock has a high potential of going bullish.

AAPL : think we start to see Wave (C) upEarlier thought about taking a call credit spread but price never gave me a convincing entry for a day trade. Obviously it would have worked out today but it isn’t about that. Don’t trade just to trade; some of the best trades are no trades! Who knows, I could have done that trade today and the market decides to have a complete opposite event of today, where I would have taken a loss!
I think we start to see wave (C) up here. We easily can fluctuate from here down to 238 area but I am leaning towards to start up.
Started small long today. Will either 1) look to build long on an established 1-2 wave; or 2) watch this demand zone, breaking down and out of this zone will signal a stop loss for me. But again, I think we can see some upward movement.

AAPL : enter short at supplyHonestly can’t make up these levels. Stay true to your game plan and put consistency in your favor.
Waiting for A B C up for wave 2 of 1 of the larger c wave down for (B). I will be looking for price to enter back between 258 - 260, watch price action, then enter a short position with a first target price of $245.


AAPLAAPL seems to be rejecting the 200DMA. Regaining this level is key for continuation upwards but this move seems to be petering out.
We could see a move back down to $228 and a failure to hold that demand zone could see us revisit lows. Demand should be strong at the psychological $200 price but let's see how we react to higher levels.
Above, we would need to break $260 supply zones in order to be bullish on a move back up to $300.

"Apple: next Support Zones to control" by ThinkingAntsOk4H Chart Explanation:
- Price broke the Ascending Trendline.
- It is currently on an important Support Zone.
- Expect a pullback from here and, then, price will start a huge down move.
- We are looking for sell setups on lower timeframes.
Weekly Vision:
Updates coming soon!

dead cat bounce ? trading idea SMIC 15 Match 2020Time will tell.
EP: 15.50
SL: 16.22
TP: 10.50
Trade period ~ 3 weeks

AAPL, RESISTENCE AND SUPPORT ZONES 1.3.2020Hi, traders.
My name is Lukas and I am a beginner in trading, respectively, I only trade 6 months. But that means I have to do the necessary analyzes without it I can't trade. I want to show you how I work on myself and document my beginnings. I use Vix and my strategy is built on to return to average. I highlight the important support levels and resistances that flow from the volume profile, all drawn on graph. These zones determine the ability to respond in some way to the market from 1 to 3, with 1 being the largest.
Short description of analysis:
We have experienced a big sale last week, the volatility index is high as it was in 2015 and 2018, currently an extreme period. This means that we need to monitor the market, we are at the border that determines where the market will go. In case of breaking the support zone (2) we can look up to 200$ - 180$. Of course, my analysis does not serve like market forecasts and I am not responsible for your trades if you use my analysis for your own trades.

AAPL Long LONG opportunity on AAPL TP and SL marked on chart. drew fibs form major low on daily chart to most recent high. APPLE held well right over the 100.00 mark on the Fibonacci as well on the Daily 200 ema. have position running since last week Friday.

MEGA BOTTOM CALLThey laughed at me before, now they will realize the magic of wallstreet messiah
BEYOND THE GREAT RALLY. critical support met.

Apple wants to go higher After taking a dip, apple closed above 20 and 9 ema making higher high and Monday traded ended with buyers holding positions so let the runner run

Apple, big Party is about to extend or fail in 1 month.So let's see how it will play out. I'l be watching negative flip.

Fixing The Supply Variable: DJI/IOTA plusAn updated version of stocks pegged to IOTA which has a fixed supply to eliminate the supply variable when trading. Supply is often changed by the federal reserve policy. Printing money, changing interest rates, etc... This makes it hard to asses the value of the stock market. By fixing supply with IOTA's limited supply pegged against the market. The only variables that must be considered are news and demand which makes analysis work much easier. It is also easier to trade as both IOTA and stocks are likely to appreciate against the inflating USD or other native currencies.

AAPL Bull run0.98 regression uptrend ! Will the upward momentum continue? or will the formation of this island top lead to a bearish move.


Will Apple begin to Fall?Hello, Traders!
Monfex is at your service and today we overview Apple .
AAPL is forming an ascending wedge which target is the local support zone and 50% Fibonacci with MA200. It also can be a double top pattern inside this wedge .
The local resistance zone ~ $249.6
The local support zone ~ $235
Market Cap
1124.191
Share your thoughts, ideas about the market under the chart.
Watch for our Updates to be the first who gets well-timed signals !
GOOD LUCK AND LOTS OF PROFITS !!
Disclaimer
This report is for information purposes only and should not be considered a solicitation to buy or sell any trading assets. Monfex accepts no responsibility for any consequences resulting from the use of this material. Any person acting on this trade idea does so entirely at their own risk.

APPL at all time highApple is a great company, stock as well, and yes there is some nice potential, technical and fundamental to see this beauty going up in the future.
But, according to the short term technical point of view, my play is sell short.
A potential target can be at 15 to 21% from the current price.
S/L is 5% from current price
