SPY + AAPL to test lower TLSPY + AAPL daily chart. Wants to test lower blue trend line. VERY thin cloud support below trend line, can easily slice through. Solid short entry here.
Aaple

AAPL looking a bit bearish in a descending triangleAAPL looking short term bearish in a descending tringle. Possible short position with retest of resistance. Target $208.

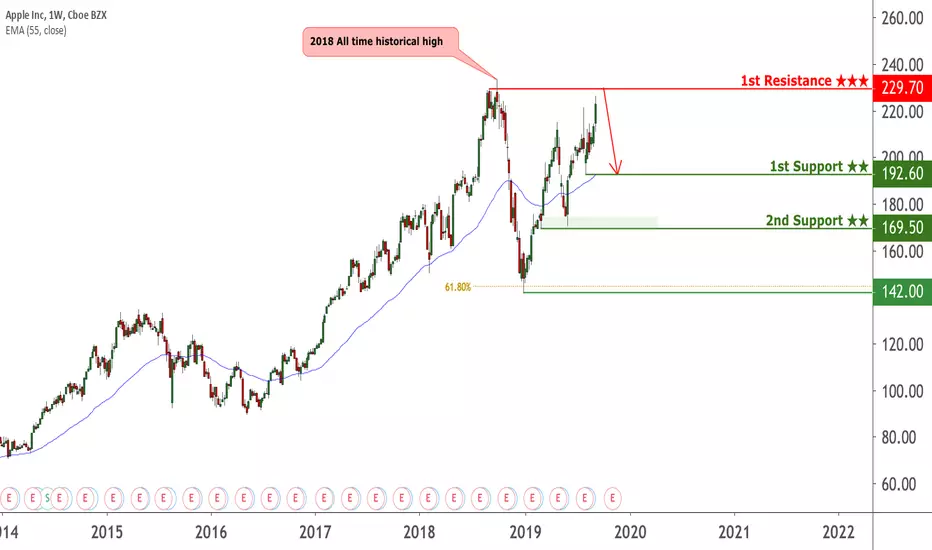
AAPL reversed from resistance, potential drop!
AAPL reversed off its resistance at 229.70 where it could potentially drop further to 192.60.
Trading CFDs on margin carries high risk.
Losses can exceed the initial investment so please ensure you fully
understand the risks.

$AAPL into EARNINGS #AAPLFirst of all $AAPL is at a mayor trendline so a miss could make us fall heavy.
If Apple has a miss in earnings, we could see a downtrend starting aiming at the 50ma weekly at $192 and 100ma weekly at $182. On the daily timeframe theirs also a lot of support around the $180-$190 zone.
If Apple has a beat in earnings. We could see $230, $260 and $270 as first take profits.
Will update this post what my feelings are going to be on the earnings from. $AAPL.

AAPl - $212 to $234 in the short termAAPL is at the top of a wedge and we should see either a break out or rejection next week.
Indicators suggest a bullish bias to break out from the wedge and begin making a run to $212 to $234.
From there, the price will either top top and retrace, or begin marching on to $290.
Buying calls with a few puts to hedge would be a good strategy.

AAPL Potential Buying OpportunityAAPL has put a nicely retrace towards 50% fib levels at the moment , and also this retracement should reverse between 61%- 78% of the fib retracement.
AAPL has key level at 156
If AAPL fails to get above 156, this should go all the way back towards 100.00 levels.
So buy back above 179 once reach 61% retracement or 78% retracement


AAPL share prices bounced back in today's session AAPL shares have bounced at the support trend line in the 30 minutes price chart at around 209.90 in today's opening trades following a price retracement in yesterdays session
AAPL shares need to break and remain above 213.00 to continue to 215.00.
AAPL shares could return to retest the support trend line marked on the chart if it fails to break at 213.00

Apple scare the shit out meLooking for history the last time apple recover so quicly was in 2007 it recover for 4 months then start to droping like hell, the question what justify apple trading at these levels, all fang not only absurd overbought, RSI Of stocks are in the 80, like msft, dis, amzn fb, the question you have to ask is why now? we are in a bull market so quickly you see in the times before that apple as fully recover always has double bottom, apple did not do that, also looking at fundamentals, during the last 5 years apple has diluted their shares nearly 19%, so EPS Look Higher, there is a lot of speculation with this stock, i think is the most speculative stock in wallstreet after tsla nflx all and amazn, i get msft has double digit growth but what has apple last quarter iphone sales decline 15% YOY and thatis 65% of his revenue, the claim services is just 10% of his total revenue, even if apple doubles that in 2 years, they have 10 years of the same product,no major changes beside better screen camara and processor, wallstreet always oversale this stock like is the best company in the world, people are buying iphone XR More than 10 thats why they are not even revealing how many units they sell, wallstreet in matter of months take apple again to hit 1 trillion? like a nothing happen, there is a lot of questions regarding the future of apple, i get is a good company, but is not was used to be, they need a new product, now all people buying the stupidity of services like is a big deal, i think apple could cut guidance, market is not expecting so much move because of volatility but look what happen with intel, everyone was so bullish and then earnings fall 10%, with volatilty at 12% dont want to imagine with vix at 20, so, i think apple could fall 188-190 the next week but who knows, these irrational market im all in short here, i just buy 195 puts May 17 GL To all traders!

AAPLlooking at the AAPL stock I could conclude that it is a clear bu as you can see the chat has bounced off the 4H support and is now having a reversal to the resistance

AAPL - Weekly Review Feb 25 - Mar 01$AAPL didn’t do much throughout the week and stayed in a range. It gapped up at the start of the week, hit the breakout/resistance level and sold off from there. Weekly Outlook chart is in the related ideas.

$AAPL - Weekly Outlook Feb 25 - Mar 01$AAPL hasn't done much in the last 10 day trading days and has stayed tightly range bound. Upcoming resistance area is 175.57 - 176.94. Once this resistance is cleared, its most likely headed to 181.50 and then 184.70. If there is a sell off next week, it will most likely bounce from 168.39 - 167.19, and will also find support at the up trending line. AAPL is a good buy for a swing in the buy zone as identified by the support lines.
US-China trade news can make it go in either direction. Next week is news critical. Markets will make moves depending on what kind of trade-related news we get.
If you would like me to analyse a stock ticker, please feel free to mention in the comments.


AAPL Weekly SignalAs you can see in the graph above Apple's share fell nearly 40 percent from its peak And stopped right on Moving Average 200 And since then the price has been rebounding And completed a weekly rise, we add the Fibonacci indicator to give us Take Profit prices
Our Signal: Buy AAPL
Entry Price: 156.5
Take Profit: 166


AAPL Bridging the gap with news (Bite or Fuel it)On 2nd Jan apple went down hard around 10% during post market thus creating plunge gap due to un-settlement trade regulation policy between US & China. Therefore on following day 3rd Jan APPL seem to retrace back from 146 resistance. On previous friday, after Major announcement on US earnings; APPL manage to bounce back from 52-weeks all time (142) towards 148+ align with major indexes making gap down less to 7%.
The Gap fulfill is a very interesting subject for Apple, current situation expecting further climb to 150 on Monday; subject if 149 breakout able to occur. Less than that a retrace will be on favor.
Positive news might shoot apple beyond 150 but for past 3 days news were likely interest on selling side; beyond 150 was pretty optimistic however on previous history charts AAPL were capable to push the spike up more than 6%.
Approach with cautious and going to be neutral on AAPL.

Apple (AAPL) Has Probably Plateaued I'm doing this main chart using the log scale because it makes it so obvious that growth is slowing down. We just got rejected hard off the resistance that has held us since the 80's! We're also in a giant rising wedge, and are JUST touching the bottom of it right at this very moment (actually, I'm being generous with my line. In truth, we've broken down already). Now, I don't think Apple will disappear. That's not what this analysis is about. As I've mentioned recently, I think many tech stocks have plateaued. Some may continue higher eventually, but Apple most likely will not grow much. Why? I think the world's population has peaked, and people's interest in technology has also peaked. People who speculated on Apple have also walked out with massive profits. Just look at that graph! In my opinion, and I know it's controversial, there is no reason for Apple to continue to grow at an astronomical rate. As you can see, growth has clearly reached a point that it cannot sustain and it will likely flatline, or experience a long period of slow growth. Their tech has simply become a part of our daily lives. It's almost part of our biology at this point. Why speculate on it anymore? I argue that by becoming so valuable, it has actually set the stage for its own demise. I don't know if this makes any sense to you. By demise I mean stagnation, basically.
Anyway, where Apple flatlines is anyone's guess. We have some possibilities on this chart (green zones). It could be fairly near current prices (in the $80-100 area). Or it could be in the $50 zone. That seems more likely to me, given the size of the tech bubble.
I think people will continue to use Apple products every day, so I don't see it really falling off a cliff permanently. It's also dropped pretty substantially from it's all-time-high already. As I mentioned in my DJI analysis, I was pretty sure it would not be able to sustain above the $1 Trillion market cap. I was surprised that it held up there as long as it did, to be honest. A lot of people out there will keep on harping about investing and how everyone should still hold Apple stock in their portfolio. I do not think there is much upside anymore. It might EVENTUALLY gain back a good amount of what it's lost since the ATH, but I doubt it'll reach beyond $1 Trillion again. This is just my view, though. I could be totally wrong. I just have a feeling about it though.
I am not a professional financial advisor, and this is not financial advice.
-Victor Cobra

FAANG's Slow Death RideFaang composite and my prediction for the next couple of years. White line is projected price action, which I believe will be controlled by Algo trading bots.

$AAPL analysis From 225 to 155 looks like wave C - triple zigzag
Very fast and deep correction
The long-term flat correction, which we designated as triangle A-B-C-D-E, makes us doubt that the entire current correction, which lasts from 234, is only wave A. Most likely we are facing the end of A-B-C
It is possible that the minimum of correction has not yet been passed, but the probability of a change in the trend to growth is extremely high.


Apple Dropped From The Tree. EUREKA..This chart suggest me Here We Have A BUBbbLLEE..
aNY NEW tech from apple ?
Phone same phone.
So what the stock price is that man.
Come on. BUBBBLEE..
BiG SHort.

