APPLE IS UP 7 MONTHSIN A ROW A X 1.618=195.47THE chart posted is that of Apple . we should begin to see weakest as we are now up 7 months this is stretched in time in the last 14 yrs
Aaple

Apple remains at the topApple's stocks are on a strong upward trend, with hidden targets along the way. By practicing capital management, you can achieve substantial profits from it."

Apple -> New All-Time-HighHello Traders and Investors ,
my name is Philip and today I will provide a free and educational multi-timeframe technical analysis of Apple 💪
Starting on the monthly timeframe you can see that after Apple broke out of the clear triangle formation in confluence with the bullish moving averages, Apple created a strong rally of 30% towards the upside, breaking major resistance.
The weekly timeframe is also showing that Apple is not slowing down at all, there are barely any red candles which means that buyers are 100% in control of the overall bullish market.
And after Apple gapped higher on Friday, the daily timeframe is certainly ready for a short term technical pullback to fill the gap, but then there is definitely a higher chance that the next move on Apple stock will be again towards the upside.
Keep in mind: Don't get caught up in short term moves and always look at the long term picture; building wealth is a marathon and not a quick sprint 📈
Thank you for watching and I will see you tomorrow!
My previous analysis of this asset:

Ninja Talks EP 18: The FOMO ParadoxThe FOMO Paradox: Fearlessly Embrace the Joy of Missing Out
In the vast realm of trading, where fortunes are made and lost, one peculiar phenomenon reigns supreme: FOMO, the Fear of Missing Out. It is a force that tempts even the most seasoned traders, whispering in their ears with alluring promises of quick gains and overnight success. But in this whimsical journey through the tradingverse, we shall embark on an intellectual escapade to unravel the paradoxical nature of FOMO, armed with humor, wisdom, and the power of restraint.
1. The FOMO Symphony: An Ode to Irrationality
Imagine, dear reader, a symphony hall filled with traders, each playing their instruments of irrationality. The violins of impulsive buying, the trumpets of chasing trends, and the drums of unchecked greed. Amidst this cacophony, the conductor whispers, "Fear not the fear of missing out, for it is but a deceptive melody, luring you into a dance of folly."
2. The 'Emo' of FOMO: Trading with Feelings
Ah, the emotional rollercoaster of FOMO, where rationality takes a backseat and the heart commands the trades. It's like being on a blind date with the market, where you're desperate for a connection, but all you end up with is a hefty loss and a broken heart. Remember, dear trader, emotions make for terrible trading partners. As Warren Buffett wisely said, "The stock market is a device for transferring money from the impatient to the patient."
3. FOMO and the Illusion of Predictability
In the enchanted land of trading, FOMO whispers sweet tales of predictable trends, promising riches to those who dare not miss out. But as the legendary trader Jesse Livermore declared, "The market is designed to fool most of the people most of the time." So, when FOMO comes knocking at your door, be ready to greet it with skepticism and a firm understanding that market movements are as predictable as a cat chasing its own tail.
4. The Wisdom of the Watchful Owl
Picture yourself as an owl perched high atop the trading tree, observing the market with unwavering focus. You know that succumbing to FOMO means flying blindly into the night, destined to collide with unforeseen risks. Instead, let patience be your wings, and knowledge be your guiding light. Remember the ancient proverb, "A wise trader is one who embraces the joy of missing out, for it is the gateway to disciplined decision-making."
5. The 'FauxMO' Rebellion: Making Fear Funny
Let us unleash our inner court jesters and laugh in the face of FOMO! Embrace the power of satire and humor to disarm the seductive allure of quick profits. Create your own FauxMO index, where the most overhyped assets are mockingly celebrated. Treat it as a reminder that while FOMO may be real, it's better to join the circus of laughter than the parade of losses.
As we bid adieu to the whimsical tradingverse, let us etch these words into our trading strategy: "Fearlessly embrace the joy of missing out, for it is in patience and restraint that true market mastery resides." Remember, dear trader, the market rewards those who approach it with intellect, discipline, and a hearty dose of humor. So, resist the siren call of FOMO and embark on your trading journey with confidence and a twinkle in your eye. Happy trading, and may the FOMO be with you... or rather, may it be far, far away!

Apple Vision Pro Product Will Add Value To AAPL Stock
I wanted to share some exciting news about Apple’s latest Apple Vision Pro product.
This new device boasts some seriously impressive specs, including a high-resolution display and a powerful processor. But what sets it apart is its unique way of interacting with virtual reality. Instead of relying on clunky controllers, the Apple Vision Pro uses advanced eye-tracking technology to allow for a more natural and intuitive experience.
This could be a game-changer for the VR industry, which has struggled to gain widespread adoption due to its high cost and complex setup. With the Apple Vision Pro, we could see a new wave of interest and excitement in VR, which could translate into big profits for investors.
So, I encourage you to consider investing in Apple long-term. With their track record of innovation and success, I believe they have the potential to revolutionize the VR industry and bring it into the mainstream.
Thank you for your time and consideration. Have a wonderful day! Please let me your thoughts via a comment.

Apple -> Pump Might Be Over NowHello Traders,
welcome to this free and educational multi-timeframe technical analysis .
On the weekly timeframe you can see that Apple stock is currently retesting a quite massive previous weekly resistance area at the $180 level which is now definitely pressing price lower.
You can also see that over the past couple of weeks, Apple had a massively bullish rally of about 45% towards the upside without any real correction, so I am now just waiting for a short term rejection away from the resistance before I then do expect more upside continuation.
On the daily timeframe you can see that market structure is still massively bullish overall, there is no sign of Apple stock slowing down yet, so I am simply waiting for some bearish rejection at the current levels before I then do expect a short term correction towards the downside.
Thank you for watching and I will see you tomorrow!
You can also check out my previous analysis of this asset:

Apple -> Leading The RallyHello Traders,
welcome to this free and educational multi-timeframe technical analysis .
On the weekly timeframe you can see that Apple stock is approaching a quite obvious previous weekly resistance zone at the $180 level which is now turned resistance again.
You can also see that over market structure is still massively bullish, I am also definitely expecting new all-time-highs on Apple so I am now just waiting for a short term rejection and then I do expect more continuation towards the upside.
On the daily timeframe you can see that Apple stock is still creating bullish market structure with the recent break and retest of the $175 level, so there is still no sign of Apple slowing down, so I will just wait for a short term correction before I then do expect more continuation towards the upside.
Thank you for watching and I will see you tomorrow!
You can also check out my previous analysis of this asset:

Apple -> Short Term TopHello Traders,
welcome to this free and educational multi-timeframe technical analysis .
On the weekly timeframe you can see that Apple stock is currently approaching a quite massive previous weekly resistance area at the $175 level which is now turned strong resistance once again.
You can also see that over the past couple of weeks, Apple stock had a rally of about 35% towards the upside without any noticable correction, so I am now just waiting for a short term rejection away from the resistance area and then I do expect more continuation towards the upside.
On the daily timeframe you can see that Apple stock is still creating bullish market structure and moving averages are also massively bullish, so I am now just waiting for some consolidation and bearish pressure before I then do expect a short term dump away from the resistance area.
Thank you for watching and I will see you tomorrow!
You can also check out my previous analysis of this asset:

Apple -> Breakout Baby Let's GoooHello Traders,
welcome to this free and educational multi-timeframe technical analysis .
On the weekly timeframe you can see that Apple stock is currently breaking out of a multi-months long consolidation phase with the previous resistance being exactly at the HKEX:165 area.
You can also see that from a weekly perspective, market structure is extremely bullish, we have the next strong resistance at HKEX:175 so I simply do expect more continuation towards the upside from here and eventually a break above the resistance and also new all-time-highs for Apple.
On the daily timeframe you can see that with today's candle, Apple stock is breaking above previous daily resistance which is now turned support so I am just waiting for a retest and some bullish confirmation before I then do expect lots of continuation towards the upside from there.
Thank you for watching and I will see you tomorrow!
You can also check out my previous analysis of this asset:

Apple to find support at previous resistance?Apple - 30d expiry - We look to Buy at 156.61 (stop at 151.11)
This is curremtly an actively traded stock.
Our bespoke resistance of 157.50 has been clearly broken.
Previous resistance at 156.00 now becomes support.
The primary trend remains bullish.
We look to buy dips.
Our profit targets will be 170.66 and 172.66
Resistance: 162.50 / 165.00 / 166.84
Support: 159.78 / 156.00 / 154.00
Please be advised that the information presented on TradingView is provided to Vantage (‘Vantage Global Limited’, ‘we’) by a third-party provider (‘Signal Centre’). Please be reminded that you are solely responsible for the trading decisions on your account. There is a very high degree of risk involved in trading. Any information and/or content is intended entirely for research, educational and informational purposes only and does not constitute investment or consultation advice or investment strategy. The information is not tailored to the investment needs of any specific person and therefore does not involve a consideration of any of the investment objectives, financial situation or needs of any viewer that may receive it. Kindly also note that past performance is not a reliable indicator of future results. Actual results may differ materially from those anticipated in forward-looking or past performance statements. We assume no liability as to the accuracy or completeness of any of the information and/or content provided herein and the Company cannot be held responsible for any omission, mistake nor for any loss or damage including without limitation to any loss of profit which may arise from reliance on any information supplied by Signal Centre.

Apple -> Short Term ReversalHello Traders,
welcome to this free and educational multi-timeframe technical analysis .
On the weekly timeframe you can see that Apple stock is currently retesting a quite obvious previous weekly downtrend resistance line exactly at the $165 area.
Also just recently Apple stock created a weekly inverted head and shoulders so I definitely do expect the market to reject this downtrendline to retest the neckline of the inverted head and shoulders at the $155 area and then from there create more continuation towards the upside.
On the daily timeframe you can see that market structure is still massively bullish so I am now just waiting for Apple to show me some more bearish rejection at the current levels and then there is a high chance that we will see a short term rejection away from the downtrend resistance trendline.
Thank you for watching and I will see you tomorrow!
You can also check out my previous analysis of this asset:

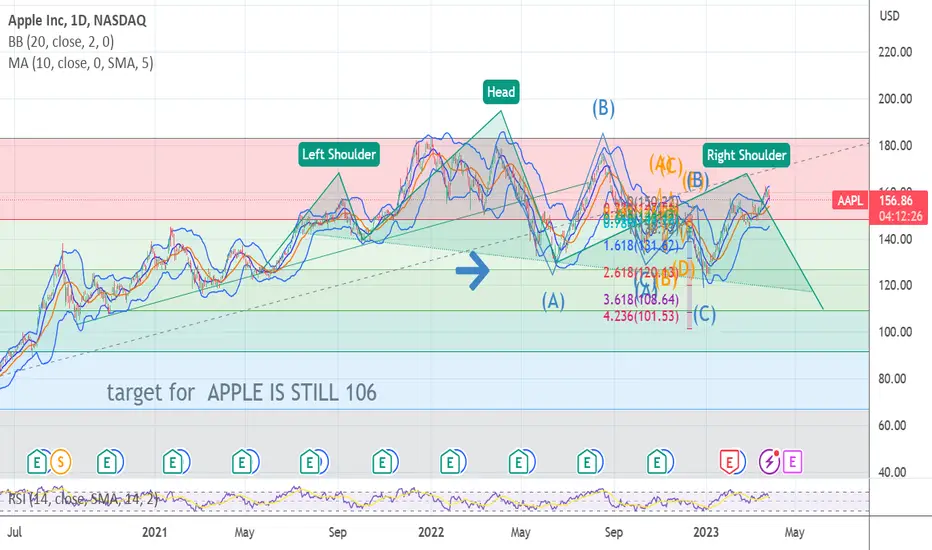
AAPL Short Idea for Long TermAAPL is bearish in Long run. High probability of Price test the Supply zone of 172.26 - 176.27 and a fall to the demand zone of 136.25 - 133.77 followed by an Imbalance in Price.
A strong reversal pattern of AB=CD has been established followed by a continuation pattern of H&S which can help the price reach to the supply area.

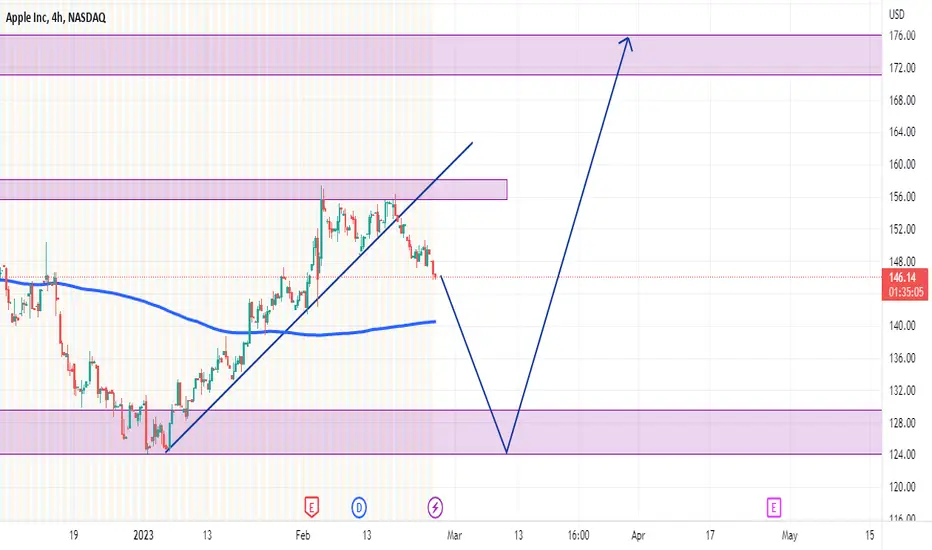
AAPL bullish play ideaAAPL is onto big things 2023-2024!
Apple is a technology company that designs, manufactures, and sells consumer electronics, computer software, and online services. The company is well-known for its innovative products such as the iPhone, iPad, and Mac computers. Apple is also one of the largest companies in the world by market capitalization, with a strong balance sheet and a history of generating significant profits.
Over the past decade, Apple's stock has performed very well, with the share price increasing more than fivefold from around $50 per share in 2010 to over $250 per share in 2020. Apple has consistently delivered strong financial results, with revenues and earnings growing steadily year over year.
There are several factors that have contributed to Apple's success and strong stock performance. One key factor is the company's focus on product innovation, with a track record of releasing popular and high-quality products that have captured a loyal customer base. Apple's brand strength and customer loyalty have helped to maintain strong demand for its products, which has translated into strong financial results and stock performance.
Another key factor is Apple's financial strength and stability. The company has a large cash balance and generates significant free cash flow, which it has used to invest in research and development, acquisitions, and share buybacks. This has helped to support Apple's growth and profitability over the long term, which in turn has translated into strong stock performance.
AAPL stocks are always bullish.

Apple -> The Bulls Are StrongHello Traders,
welcome to this free and educational multi-timeframe technical analysis .
On the weekly timeframe you can see that Apple stock just recently perfectly broke above a key previous weekly resistance area exactly at $155 and now after this break all of this previous resistance is turned support.
You can also see that we have a long term downtrendline coming in exactly at $165 which is turned very strong resistance again, so I am now just waiting for a retest of the $155 support area and then I do expect a move to retest the $165 resistance line.
On the daily timeframe you can see that my last analysis on Apple (linked below) already played out nicely, I am now just waiting for a minor break and retest of the current resistance area before I then do expect more continuation towards the upside.
Thank you for watching and I will see you tomorrow!
You can also check out my previous analysis of this asset:

APPLE I.T. SELL IS NOW IN FORCE UNTIL JUNE 10 WEEK I now see the safe haven APPLE has now ready to roll over we stopped at .786 of the rally from the 129 rally to 176 peak at my aug 16 th turn we now have 3 sprials into my march 21/23 window and and have rallied into .786 of the last wave .THIS IS NOW NEGATIVE
Apple -> All Eyes On The BreakoutHello Traders,
welcome to this free and educational multi-timeframe technical analysis .
On the weekly timeframe you can see that Apple stock is once again retesting the quite strong resistance area exactly at $156.
You can also see that this is already the fourth retest from a weekly perspective and the more often we actually retest a zone, the higher the likelihood that we will eventually break it, so from a weekly timeframe I am now just waiting for a breakout above the resistance and a retest and then definitely the continuation towards the upside.
On the daily timeframe you can also see that Bulls are always trying to push Apple stock above the resistance, I think that we are definitely ready for a breakout with my next upside target being at $165.
Thank you for watching and I will see you tomorrow!
You can also check out my previous analysis of this asset:

Apple to break even higher?Apple - 30d expiry - We look to Buy a break of 157.65 (stop at 152.04)
This is curremtly an actively traded stock. 157.50 has been pivotal.
Short term momentum is bullish.
A break of the recent high at 157.38 should result in a further move higher.
Our outlook is bullish.
The primary trend remains bullish.
Our profit targets will be 171.65 and 173.65
Resistance: 157.50 / 160.00 / 163.50
Support: 152.50 / 149.50 / 143.90
Please be advised that the information presented on TradingView is provided to Vantage (‘Vantage Global Limited’, ‘we’) by a third-party provider (‘Signal Centre’). Please be reminded that you are solely responsible for the trading decisions on your account. There is a very high degree of risk involved in trading. Any information and/or content is intended entirely for research, educational and informational purposes only and does not constitute investment or consultation advice or investment strategy. The information is not tailored to the investment needs of any specific person and therefore does not involve a consideration of any of the investment objectives, financial situation or needs of any viewer that may receive it. Kindly also note that past performance is not a reliable indicator of future results. Actual results may differ materially from those anticipated in forward-looking or past performance statements. We assume no liability as to the accuracy or completeness of any of the information and/or content provided herein and the Company cannot be held responsible for any omission, mistake nor for any loss or damage including without limitation to any loss of profit which may arise from reliance on any information supplied by Signal Centre.

Apple -> Could It Be More Obvious?Hello Traders,
welcome to this free and educational multi-timeframe technical analysis .
On the weekly timeframe Apple stock is currently retesting a quite obvious previous resistance area which is turned resistance once again.
Just recently we also had a bullish ema crossover, which is always considered a bullish sign, so from here I do expect a short term rejection away from the support zone and then the longer term continuation towards the upside.
On the daily timeframe it seems like today's candle will close with a massive rejection wick, indicating selling pressure so it is quite likely that we will see at least a short term rejection away from this resistance area.
Thank you for watching and I will see you tomorrow!
You can also check out my previous analysis of this asset:

AAPL's next target is $176.40
The short-term resistance for AAPL is at $157.40, and the current market is very close to it after experiencing an uptrend. The market sentiment is bearish, but as others fear, I am greedy. Although there is a need for adjustment in the market, the probability of AAPL continuing to rise and break through in the future is higher. Short-term profits can be taken, but the view of being bullish on AAPL in the medium and long term remains unchanged.
Personal suggestion: Continue to enter the market for long positions near $150, with a target of $176.40 and a medium to long-term layout. It requires a certain amount of capital pressure resistance and a good mentality. I will continue to update my views on AAPL in the future, please stay tuned.

Apple -> Is This The Top?Hello Traders,
welcome to this free and educational multi-timeframe technical analysis .
From a weekly timeframe Apple stock just recently tested and already rejected a very obvious previous weekly resistance area which was turned resistance once again.
You can also see that we are having a bullish weekly ema crossover, however I personally think that we will retest the next support area at $135 before then creating the continuation towards the upside.
On the daily timeframe I am now just waiting for a clear break and retest of the previous support zone which would then be turned resistance before I then do expect a next short term impulse towards the downside.
Thank you for watching and I will see you tomorrow!
You can also check out my previous analysis of this asset:

here an idea about APPLEhi every one
this is how is apple chart look like for me and i wan to know your idea too
The information provided on this Page does not constitute investment advice, financial advice, trading advice, or any other sort of advice and you should not treat any of the website's content as such. this page does not recommend that any cryptocurrency should be bought, sold, or held by you. Do conduct your own due diligence and consult your financial advisor before making any investment decisions

Apple -> New All Time Highs ComingHello Traders,
welcome to this free and educational multi-timeframe technical analysis .
Over the past couple of weeks Apple stock had a quite nice pump towards the upside, again rejecting a massive weekly previous support zone , so this recent rally was definitely not unexpected.
Currently we are quite overextended towards the upside and also retesting a resistance zone ; therefore I do expect a short term retracement but then the longer term continuation towards the upside.
From a daily timeframe I am now just waiting for a retest of the next support area from which we could then definitely see the next impulse towards the upside.
Thank you for watching and I will see you tomorrow!
You can also check out my previous analysis of this asset:
