Aaplshort

AAPL BULLISH AND BEARISH SCENARIO (DOUBLE TOP) $$$As you can see, a double top formed weeks ago, and since the second peak in price, AAPL has been consistently declining, indicating that the market has properly priced this double top. We are on our way to the neckline, which tells us that if we bounce off it, we may retest the resistance, but if we break it, we will see serious bearish price action.

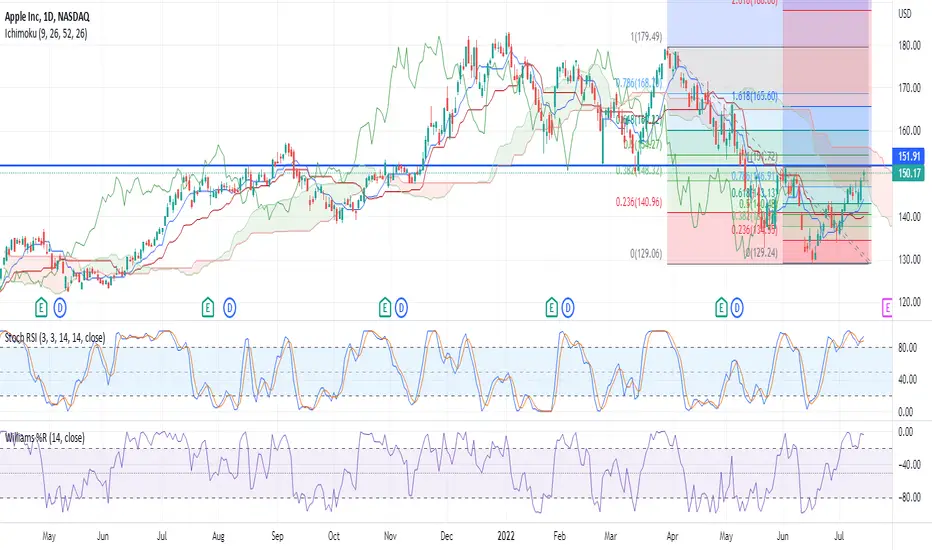
Apple - Will next earnings reinforce the selling pressure?After the 242% run-up from its lows during the 2020 crash to its high in January 2022, Apple gave up almost 20% in regard to the current value. In addition to that, the introduction of the new iPhone 14 has not created much hype among consumers and market participants. Since the release of the new product, the price has continued to be choppy and seemingly returning to its 2022 lows.
Because of that, we will continue to monitor the Apple stock in the coming weeks and provide a more detailed update on the price and its potential future direction. However, at the moment, we abstain from setting a price target for this stock title.
Illustration 1.01
Illustration 1.01 displays the daily chart of Apple stock and two moving averages, 20-day SMA and 50-day SMA. In addition to that, two yellow arrows point to natural retracements toward the price's moving averages, acting as a correction of the downward move. If the price fails to break above the 20-day SMA and then subsequently above the 50-day SMA, then it will add to a bearish consensus.
Illustration 1.02
The picture above shows the weekly chart of Apple stock and two simple moving averages; now, 20-week SMA and 50-week SMA. The yellow arrow pinpoints the similar retracement toward (and even above) these SMAs; in this particular example, the retracement represents a strong correction of the downtrend.
Please feel free to express your ideas and thoughts in the comment section.
DISCLAIMER: This analysis is not intended to encourage any buying or selling of any particular securities. Furthermore, it should not be a basis for taking any trade action by an individual investor. Therefore, your own due diligence is highly advised before entering a trade.

AAPL Apple Inc. Technical Rebound before $130Maybe the timing wasn`t perfect, but AAPL eventually reached the price target and went even lower:
Now i am expecting a technical rebound, Apple being oversold on the RSI; before dropping to $130 once again.
Looking forward to read your opinion about it.

AAPL bearish hammer on monthlyConcerned about seasonal iPhone announcement hype, but all in all there's a bearish hammer on monthly and I should take it.

2X $AAPL MEETS TREND LINE, TP 2 HIT 10%$AAPL has been on a run since JUNE '22, but it was time for a reversal to set in after rejecting the trendline in this bearish market we had to catch this move to the downside! TP2 HIT! Almost 12% Move with $19.35 price change. We are playing the pullbacks and moved down to @ TP3!

AAPL short to 85$, not tomorrowMaybe because of chips, i don't care actually why,
But AAPL is starting bear market
It will lasts till spring 2024
Buyer zone is highlighted
1st Target 300$ not earlier than summer 2025
There are higher targets, the highest one is at 2027 - 900$

Apple (AAPL) - Taking a bite out of its Market CapGood Day. We've seen recently in the markets, an over-exuberant reaction to the possibility of the Fed inexplicably changing course, in the face of generationally-high levels of inflation, that threatens to become endemic, and create longer-term problems for the US (and other global) economy.
Mr Market may have realised they could have got their bets 'slightly wrong'.
And these past few weeks, we've been tracking Apple - taking profits, and exiting completely in anticipation of THIS move.
Forget cognitive bias and your emotions - sometimes you can be bearish on the broader market, and yet still bullish on the stock. If that's the case, depending on the weakness of the broader market, it may be time to sell, take profits and wait for the next opportunity to scale in.
Let me know what you see in the charts above.
Order Flow, Liquidity, Market Structure = all the confluences we use and need to know, when trading.
Check our profile if you're interested - we look to post regularly here, and we're also posting frequently on our other platforms. Cheers.
Best,
Figuring Out Finance

2X $AAPL TP1 HIT, 4HR Tech. Analysis!$AAPL has been on a run since JUNE '22, but it was time for a reversal to set in after rjecting the trendline in this bearish market we had to catch this move to the downside! Almost 5% Move with $8.40 price change. We are playing the pullbacks and moved down to fill the Gap @ TP2!

AAPL ShortHi Everyone,
I'm waiting for Short if the break break the trend-line.
Signals:
- Price in Resistance & Fibonacci
- Main Trend, Bearish .
- Close to The top of the Bearish-Channel.
Good Bye & Good Trading!!!

AAPL to 0The Big Short
Apple's tech is falling behind most major competitors. Without Steve Jobs, it is doomed.
The buying volume is also really bad.
Shorting to ZERO :)

2X $AAPL MEETS TREND LINE, There is a Possible -25% Move!$AAPL MEETS the long awaited bearish trendline we see a see a nice rejection! I think this signals a reversal we will hop in puts and sells only until otherwise!

AAPL TO $116....SELL (33%)THIS SOUNDS CRAZY THO!!!
looking at AAPL chart, you could clearly see an overbought price for AAPL stock....this week's candle reject from the previous highs and also since AAPL contributes to the highest percentage in US500....a decline is positively correlated as such!!!
Also, Due to the increasing strength of the USd as a result of the increase yield....still looking on to the short of stocks.
NB: Red box: rejection zone
Blue Box: breakout zone
A clear breakout of my breakout zone clearly breaking my EMA's shows an active response!!!

$AAPL losing steam?$AAPL surge up since the start of summer along with the overall market. pending news about the new iphone 14 but the productions shortage and units makes it uncertain due to supply chain issues and inflation. overall big institution likes this stocks and its cash. but keep in mind that the stock has been up for couple months now with now massive pull back. so bears has been watching AAPL and waiting for opportunity.
here's my price range for AAPL
============================================================
For calls; buy above $174.90 and sell at 176.15 or above
For puts, buy below 173.60 and sell at 172.60 or below
============================================================
Welcome to this free technical analysis . ( mostly momentum play )
I am going to explain where I think this stock might possibly go the next day or week play and where I would look for trading opportunities for day trades or scalp play.
If you have any questions or suggestions on which stocks I should analyze, please leave a comment below.
If you enjoyed this analysis, I would appreciate it if you smashed that LIKE or BOOST button and maybe consider following my channel.

Bad News for AAPLRest
In
Piece
Apple
Holders
Your time has come.
And this is my official Warning
Beware.
Evidence:
1) $1.3 B in Dark Pool Prints
2) Millions of premium in puts
3) Millions of premium in spy puts
4) The great TA seen above

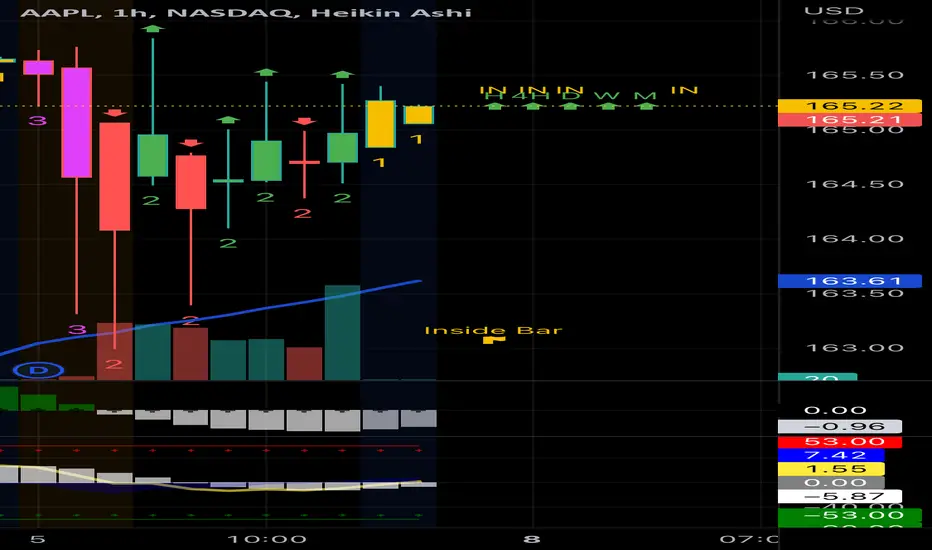
$AAPL entering squeeze$AAPL bout to enter the squeeze momentum in 1hr chart as the sellers slowly weaken. no majors news lately besides the previous earnings. highly anticipated earnings are over, so market might react in economic data for this week.
here my price target for AAPL for monday 08/08/22.
============================================================
For calls; buy above $166.25 and sell at 167.00 or above
For puts, buy below 164.55 and sell at 163.33 or below
============================================================
Welcome to this free technical analysis . ( mostly momentum play )
I am going to explain where I think this stock might possibly go the next day or week play and where I would look for trading opportunities
for day trades or scalp play.
If you have any questions or suggestions on which stocks I should analyze, please leave a comment below.
If you enjoyed this analysis, I would appreciate it if you smashed that LIKE or BOOST button and maybe consider following my channel.
Powerful Breakout At AAPL With 80% Chance Of The Market Going UpT.R.S (Triangle Of Resistance And Support)
1- As you can see the market tried to break
The Resistance line at 4 different Points,
and On the 5th black point he break the R line succefuly .
2- For the Support Line, we have 4 important Points
which they played the role of a solid support Points.

Powerful Breakout At AAPL With 80% Chance Of The Market Going UpT.R.S (Triangle Of Resistance And Support)
1- As you can see the market tried to break
The Resistance line at 4 different Points,
and On the 4th point he break the R line succefuly .
2- For the Support Line, we have 4 important Points
which they played the role of a solid support Points.

APPLE AAPL Sell NowAccording to my chart analysis , AAPLE AAPL show strong signal to sell , sell AAPLE AAPL Now

AAPL SELL +++How can AAPL guide higher? I say they cannot with a strong dollar, slowing hiring, slower spending means slower growth. AAPL should see $121-126 next pitstop and long term (months to years) under $80 as low as $65. I am incredulous all the people calling for a bottom, we are no where near a bottom!! We haven't seen the implications of a recession/ depression yet. Millions of layoffs, business closing, foreclosures, repossessions, defaults then and only then can we discuss a bottom. There will be many bear market rallies which I also will be posting when I see a long as I did in AAPl at $129-130 I first predicted $141-143 then raise that level to $151 when technical were updated. No one can call a top and last monday my puts were up 50% plus and Tuesday that disappeared. I added Thursday and Friday as my view has not changed.

AAPL Apple Inc Options Ahead Of EarningsLooking at the AAPL Apple Inc options chain today, i would buy the $130 puts with
2023-1-20 expiration date for about
$5.20 premium.
Looking forward to read your opinion about it.

AAPL SELL over $151AAPL is overbought here and I have been watching for an entry point over $140+ $151 looks to be a short term top where I will be looking to start a position and add every $2 in share price increase. We had a bear market rally last week where bad news is good news and all stocks were lifted higher. The VIX is oversold I would expect it to bounce along with AAPL and others to reverse lower. IF anyone started a short position sooner, $140+ this would be the place to double up on your position to lower your average.
AAPL Short Position (1:5 ratio)AAPL short position set-up here.
Former support turned resistance about to get hit. Along with the high RSI at 70+ I'm expecting a move downward. My target is the strong 140 support. However I may look to sell earlier at 142 or 142.50 and take gains.
Target 1 = 150.00
Target 2 = 142.50
Target 3 = 140.00
SL = 158.50
Low risk high reward play. Although be aware of earnings next week.
