AAVE: Resistance BreakoutAAVE (AAVE) technical analysis:
Trade setup : Following a bullish breakout from Channel Down pattern, price rallied 40% and has broken above 200-day moving average, which could signal bullish trend reversal to Uptrend. Upside potential to $80.
Trend : Uptrend on Short-Term basis, Neutral on Medium-Term basis and Downtrend on Long-Term basis.
Momentum is Mixed as MACD Line is below MACD Signal Line (Bearish) but RSI > 55 (Bullish). MACD Histogram bars are rising, which suggests that momentum could be nearing another upswing.
Support and Resistance : Nearest Support Zone is $50. The nearest Resistance Zone is $65, which it broke, then $80, and $95.
Aave

AAVE Next Support & ResistanceAAVE Next Support & Resistance
55.13252456
62.2408754
66.57717465
73.20067885
81.39141304
93.48252256

Mean Reversion trades on AAVE Mean Reversion is the simple strategy of price moving 'too' far away from its averages and potentially requiring a reversion before either continuation or ideally total reversal
Aave has been offering some beautiful mean reversion entries for us recently even to the point of essentially two sigma. Both the buyzone meanmove right to the sellzone meanmove. That is not usually the case to capture both in consecutive order but of course happy to see it happening to aave and a few others we are routing.
The strategy is based more so around the reversion to mean(s) rather than the total reversal
Is nice when able to capture the total reversal one peak to the next but the strategy is focused primarily on alerting once candle is 'too' far away from mean and then riding it to touching mean (even if just for a moment). These are usually short held positions rather than multi day long swing trades.
Good to focus on largecap even more so largecap 'monopolies'
Increasing interest in the monopolies in the crypto space as everything has taken a hit due to liquidity consolidating into either US yields or US dollar or even within the crypto space consolidating into ethereum away from nameless countless junk tokens.
These alerts are currently set up for just largecap as the volatility in smallcap can create a ton of risk to this strategy as volume is needed as confirmation of previous prices to revert to. I do also think monopolies will lead + be safer in macro retraces in bull market or macro reversion to mean even if just to tap 9ema on weekly before continuing bull moves.

Bulls and Bears Eye the PrizeAs of October 5, 2023, AAVE has been tracing an ascending trendline, marking a battleground between a support level of $65.60 and a resistance level of $72.87. Despite the bullish attempts to shatter this range, market forces reeled them back, causing AAVE to momentarily falter and dip below the support. However, with a resilient rebound, AAVE clawed back into the range, setting sights on a robust charge towards the resistance. The market sentiment, mirrored in the bullish convergence on the MACD, fuels the optimism, signaling a significant price action lurking on the horizon. The narrative may unfold with AAVE retesting the resistance of $72.87, and a triumphant breach here could catapult it towards a higher resistance at $75.72. On the flip side, a stumble could usher the bears into the fray, threatening a trend reversal. If the price fails to anchor above the support of $65.60, a tumble to the lower support of $62.53 could ensue, altering the market trajectory. Amidst a meme-coin market ripe with anticipation, AAVE's journey epitomizes the volatile yet hopeful saga of the crypto realm.

🔥AAVE Is Ready To Make a Massive BreakoutAAVE is inside the massive triangle. The price touch of the bottom or top of the triangle will be a bullish signal where you can consider your long or spot purchases.
The closest resistances and targets are $125 and $365 key levels.
💥most of AAVE holders are destroyed after -93% from a top. So when to break through this accumulation triangle if not now?
like❤️ and follow
Check the links and get a BONUS🎁 from me👇

AAVEUSD Strong rise but still not bullish long-term.Aave (AAVEUSD) is having a strong bullish sequence since the September 11 Low on Support Zone 1. Both the 1D MA50 (blue trend-line) and 1D MA200 (orange trend-line) are Supports now. However, it remains inside the 1.5 year long Triangle pattern and is approaching its top (Lower Highs trend-line). This suggests that the most optimal sell entry is approaching.
The previous Lower High was priced right when the price hit the 0.618 Fibonacci retracement level. The one before a little below the 0.786 Fib. Now we are approaching the 0.5 Fib so the zone between that and the Lower Highs, is the most optimal sell entry. The 1D RSI is actually printing the peak pattern of that July Lower High.
Sell and hold as long as 1D closes candles under the Lower Highs trend-line and target the 1D MA50 at 64.000. If a 1D candle closes above the 0.618 Fibonacci, buy and target 95.000 (a little below the 0.786 Fib and potential contact spot with the 1W MA100 (red trend-line) which is the long-term Cyclical Resistance).
-------------------------------------------------------------------------------
** Please LIKE 👍, FOLLOW ✅, SHARE 🙌 and COMMENT ✍ if you enjoy this idea! Also share your ideas and charts in the comments section below! This is best way to keep it relevant, support us, keep the content here free and allow the idea to reach as many people as possible. **
-------------------------------------------------------------------------------
💸💸💸💸💸💸
👇 👇 👇 👇 👇 👇

Will AAVE extend the recovery?AAVE has reclaimed a previously invalidated daily bullish order block of $66.45 - $70.70 (red) and a support zone in July. The move could present extra gains to bulls if it’s defended.
Entry: $69
Take-profit: $75
Exit: $66.15
RR: 2
A drop below the July support will invalidate the bullish bias.

AAVEUSDTBINANCE:AAVEUSDT idea
⛔"Daily crypto market analyses I provide are personal opinions & not financial advice. Trading carries risks, so do your own research & seek advisor's help.#DYOR"
Don't forget to like and comment

AAVE - SELL AREAAAVE can go up until reach $250. When reached this area, potentially it can reverse and go down.

$AAVE SHORTBINANCE:AAVEUSDT SHORT - Firstly, it had a fakeout above $62 which is the pivotal zone to hunt some stops, then deviated below again, and then retested it as resistance. This is the reason I'm shorting it here. Looking for $58 this week and we take it from there.

AAVE cryptocurrency - LONG trade. #15Hello colleagues!
We continue to publish our potential trades and today we have a potential short-term speculation.
The AAVE cryptocurrency is holding up very well on the local drop in Bitcoin and the medium-term upward trend for AAVE is not over yet:
As we can see on the 6-hour timeframe , the AAVE price has reached an important range from which a global correction may begin. But for now, we are interested in speculation on the 30-minute timeframe.
The key liquid zone for the local growth of the AAVE price is the range of $62.25-62.75. If the AAVE price falls below this liquid zone, a lot of buyer stop orders that are hidden behind each local low may be triggered:
If this happens, it will be logical to buy AAVE at $56-57 at the earliest.
Therefore, our local trade will have a fairly short stop loss, which, in our opinion, is quite fair.
AAVE short-term long
Enter = $62.25-62.75
Stop = 61.792 (- 1.01%)
TP1 = 64.10 (+2.71%)
TP2 = 65.08 (+ 4.31%)
P/L ratio = 4.26
P.S. We have also shown a potential short position on the chart. However, we do not place limit orders, as buyers can easily update local highs and only then start a correction:
We need to watch and make a decision at the moment of the $65 retest.
What do you think, will the trade work out? Write in the comments and we will check how many people were right!

AAVEUSD In the middle of an aggressive rally. Still time to buy.AAVEUSD is testing the MA200 (1d) after a rebound on Support Zone (1).
If broken, this rally will most likely be extended to the Falling Resistance Zone, as the prior two did.
Trading Plan:
1. Buy either on a pull back to the MA50 (1d) or if the price crosses over the MA200 (1d) first.
Targets:
1. 83.000 (a little under the Falling Resistance Zone).
Tips:
1. The MACD (1d) reveals on what part of the previous rallies we are currently at. The symmetry is strong indicating that this is indeed a rally that has just started.
Please like, follow and comment!!

AAVE short setup After the breaking of dynamic resistance and formation of bullish CH, this symbol has moved up. It is now close to an order block. This block order is fresh and unused. You can look for sell/short positions in the red box.
I specified the targets. When we reach the first target, save some profit and then change the stop to entry
I specified the invalidation level, closing a 4-Hour candle above this level will violate the analysis.
For risk management, please don't forget stop loss and capital management
Comment if you have any questions
Thank You

Area to break upward: 64.256-65.37Hello?
Hello traders!
If you "Follow" us, you can always get new information quickly.
Please also click “Boost”.
Have a good day.
-------------------------------------
(AAVEUSDT chart)
The key is whether the price can be maintained by rising above the 64.256-65.37 range.
The 64.256 point corresponds to the volume profile section of the 1W chart.
(1D chart)
I don't see any major support or resistance points.
Accordingly, if it rises above 85.7 among the currently formed support and resistance points, it is expected to show a full-fledged upward trend.
The HA-Low indicator and the MS-Signal indicator are rising and are showing signs of continuing to rise further.
Accordingly, if the price remains above 58.35, it is expected to lead to a move above 75.22.
What is important is whether it can break upward through the 64.256-65.37 range mentioned before on the 1W chart and 1M chart.
-------------------------------------------------- -------------------------------------------
** All explanations are for reference only and do not guarantee profit or loss in investment.
** Trading volume is displayed as a candle body based on 10EMA.
How to display (in order from darkest to darkest)
More than 3 times the trading volume of 10EMA > 2.5 times > 2.0 times > 1.25 times > Trading volume below 10EMA
** Even if you know other people’s know-how, it takes a considerable amount of time to make it your own.
** This chart was created using my know-how.
---------------------------------

Downward Trend and Support LevelsOver the course of the past month, AAVE has exhibited a consistent downward trajectory in its price movements. This decline has been particularly notable due to its breach of the lower boundary of its short-term upward channel, followed by a precise retracement to the channel's lower limit. This retracement has effectively extended its bearish trend towards a crucial support zone at the $50 mark.
It is noteworthy that this support level aligns perfectly with the lower boundary of the currency's weekly trading range, historically recognized as a robust demand zone. However, given the prevailing market conditions, there exists a notable potential for further penetration of this support, prompting concern regarding the breach of previous price floors.
When referring to these previous floors, we are alluding to the support levels that were firmly established in the year 2023, particularly within the range of $47.5. As it stands, the current market sentiment has created a scenario where the potential for additional price depreciation looms large, with the possibility of AAVE descending further and reaching the support range of $46 becoming increasingly plausible. This suggests that AAVE may face continued downward pressure in the near term, as it grapples with the challenge of breaking through these crucial support levels.

AAVE next support zonesDear all,
I would like to draw your attention to the current state of AAVE. In daily trading, AAVE has broken its main pivot, indicating that it may reach around $50 in the coming weeks. I recommend exercising caution and waiting until it reaches the support zone before making any investment decisions. This will provide an opportunity to enter the market at a lower price and potentially yield a profitable return.
Thank you for your attention

AAVE IS ON SUPPORT AAVE is on a support after the breakout formed with the bearish flag created. Here we see the price is being supported on the highlighted zone which can possible create a bullish reversal. By any chance of a bearish breakout on this level may invalidate the trade setup.

AAVE 50$ price level stands as strong support. Will it break it?If you look on the chart, 50$ price level stands so far as strong support. And its been 5 times, #AAVE bounced from this level.
In this Technical Analysis I want write more about possible short term moves.
You can see orange line that is Support right now. To open a short position, I would wait the coin to close with 1H - 4H candle (with body) on this line or below it. In this case the coin can drop back to 50$ or even lower.
Long position I would open If i see 4H candle close above the resistance line 56.75$ in this case the coin can bounce to other levels above (red lines) that you can see on the chart. How intense that move will be - currently hard to say. Because we are in Bear market right now. But, some news or Market Makers if they want they will push the price higher.
Thats why manage your risks and put SL to BE always

AAVE: Channel Down BreakoutAAVE (AAVE) technical analysis:
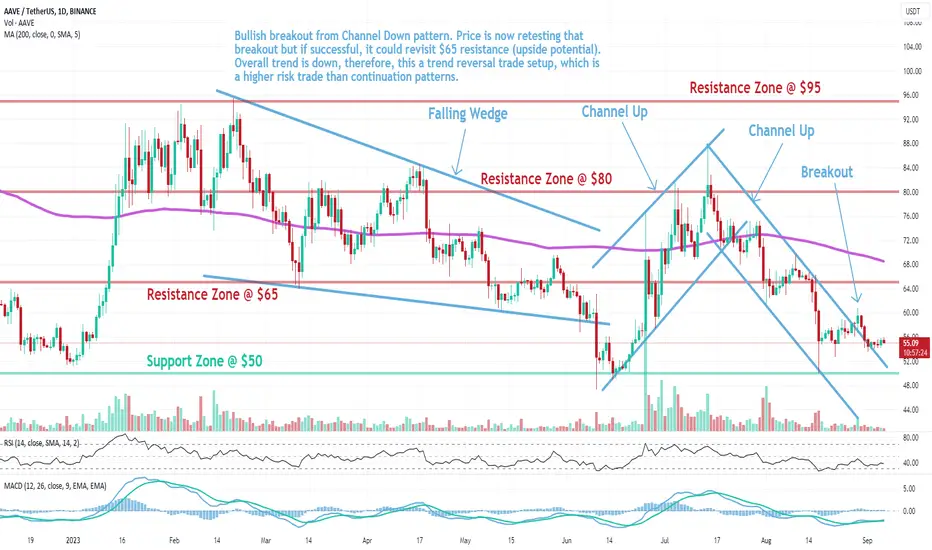
Trade setup : Bullish breakout from Channel Down pattern. Price is now retesting that breakout but if successful, it could revisit $65 resistance (upside potential). Overall trend is down, therefore, this a trend reversal trade setup, which is a higher risk trade than continuation patterns.
Pattern : Price was trading in a Channel Down pattern. With complete patterns (i.e. a breakout) – initiate a trade when the price breaks through the channel’s trendlines, either on the upper or lower side. When this happens, the price can move rapidly in the direction of that breakout.
Trend : Downtrend across all time horizons (Short- Medium- and Long-Term).
Momentum is Mixed as MACD Line is above MACD Signal Line (Bullish) but RSI < 45 (Bearish).
Support and Resistance : Nearest Support Zone is $50. The nearest Resistance Zone is $65 (previous support), then $80.
AAVE: Channel Down BreakoutAAVE (AAVE) technical analysis:
Trade setup : Bullish breakout from Channel Down pattern. Price could revisit $65 resistance. Overall trend is down, therefore, this a trend reversal trade setup, which is a higher risk trade than continuation patterns.
Pattern : Price was trading in a Channel Down pattern. With complete patterns (i.e. a breakout) – initiate a trade when the price breaks through the channel’s trendlines, either on the upper or lower side. When this happens, the price can move rapidly in the direction of that breakout.
Trend : Downtrend across all time horizons (Short- Medium- and Long-Term).
Momentum is Mixed as MACD Line is above MACD Signal Line (Bullish) but RSI < 45 (Bearish).
Support and Resistance : Nearest Support Zone is $50. The nearest Resistance Zone is $65 (previous support), then $80.

AAVE/USDT is Likely Ready for Another Correction | AAVE Analysis💎Paradisers, let's focus on AAVE/USDT for a moment. It's currently navigating within a descending channel, and gearing up for a potential downward breakout soon.
💎If the breakout materializes as anticipated, it's likely to set off a rapid corrective phase.
💎 The dual confirmed order blocks on the shorter timeframe are worth noting. These are likely targets for the price, given the existing liquidity in those areas.
💎In past action, we observed a shift from demand to supply, leading to a notable decline in price and aiming for the prior Order Block (OB).
💎As always in the fast-paced crypto world, staying alert and adaptable is crucial. Keep your charts updated and stay tuned for more insights! 🌴

AAVE coin is on the long list with a level of 58.97Hello everyone!
AIHermes today identified the coin AAVE on the long list with a level of 58.97
Entry model - breakout! Leverage 10-20X
Stop short.
We see a long accumulation and a gorgeous squeeze!
1st target 60.79
Trade with us, trade better than us!
Today:
19 coins on the short list
18 coins on the long list

AAVE .P perfomance in last 8 months in 2023This year has been a rough year for crypto. Downward pressure appears with all coins.
With the AAVE 2h frame, we see the price continuously entering the red area (possibly signaling a downtrend).
This is test result from the beginning of 2023 to the present including the current bearish period. Let's see how the S1-TM performs in a downtrend.
If you have an opinion or want to see results with Spot AAVEUSDT, please leave a comment.
