⚠️⚠️BITCOIN AND ALTS - MAJOR UPDATE ⚠️⚠️It's a video, watch it.
See how my TA did today and hear what i would expect next:
Key levels for BTC
Key levels for AAVE, ENJINM FANTOM, AVAX
A few tips for everyone.
one Love,
the FXPROFESSOR
Aave

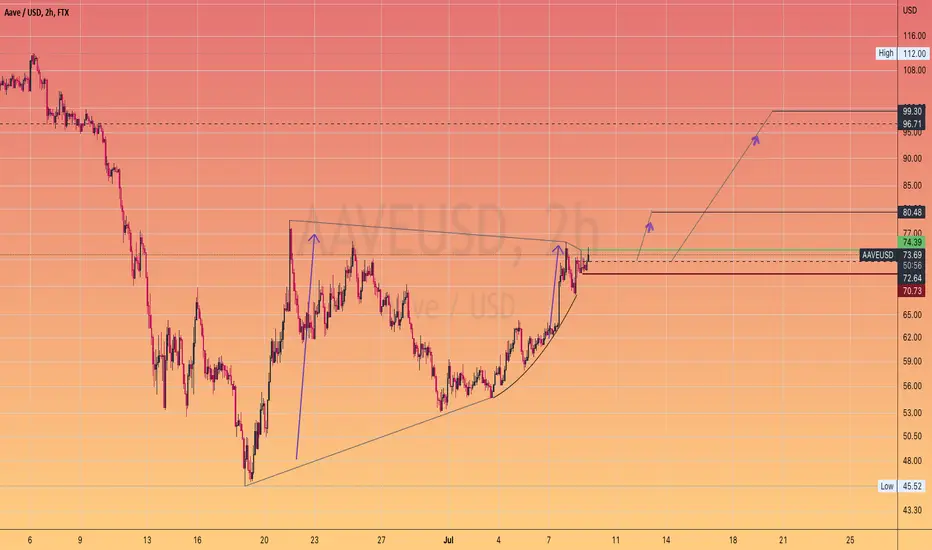
AAve long setup update!!!!!!i changed my mind about previous setup on aave because it moved up first and did not give us the bottom of channel, so we can enter in the 50% of previous wave ang get nice reward toward 112$, wait for it to arrive to the entry and do not rush, also dont miss this one!

AAVE ( bottomed out ? )AAVE / USDT
the chart looks like 1INCH chart we shared yesterday
Massive falling wedge on weekly time frame
If breakout done successfully a new and strong bullish wave will follow
Best of wishes

AAVE- Intra Day ShortUpdated chart on AAVE.
A correction could be next as the price got rejected before the 100$ mark.
One Love,
the FXPROFESSOR
PS. STILL LONG ON MANY ALTS! THIS IS A TRADE TO HEDGE THAT EXPOSURE

AAVE LONG 20220717Signal
Red -> Green
Context: Green
DISCLAIMER
This is only a personal opinion and does NOT serve as investing NOR trading advice.
Please make your own decisions and be responsible for your own investing and trading Activities.

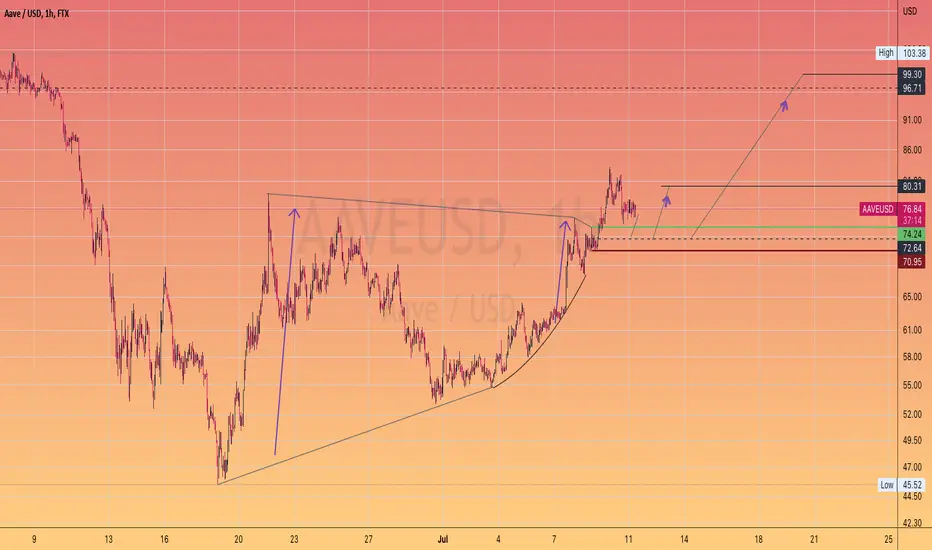
AAVE- Updated Levels and StructureVery interesting asset and chart here as AAVE is in a flag formation moving nicely in a parallel channel.
Will the price be able to break higher towards the 110$ target?
Or will it end up going back lower towards 78$ support?
I think the first scenario is more likely to happen as BTC started the week higher.
One Love,
the FXPROFESSOR

AAVEUSDTAave is a decentralized finance protocol that allows people to lend and borrow crypto.
Lenders earn interest by depositing digital assets into specially created liquidity pools. Borrowers can then use their crypto as collateral to take out a flash loan using this liquidity.
Aave (which means “ghost” in Finnish) was originally known as ETHLend when it launched in November 2017, but the rebranding to Aave happened in September 2018. (This helps explain why this token’s ticker is so different from its name!)
AAVE provides holders with discounted fees on the platform, and it also serves as a governance token — giving owners a say in the future development of the protocol.

Aave #AAVE $AAVE (July-16)AAVE just broke out of the Channel pattern and the target of this pattern is the $120 zone. We can accumulate AAVE in the $80-90 zone for the medium term target because if it breaks out of the $120 zone it will surge to the $190-200 zone.
The $120 zone is currently a very strong resistance zone so we can take profit there to avoid losing profits and consider buying back at the level of $100 for our target of $190-200.
However, we should still watch out for a possible bad case that if AAVE loses the $80 zone, we need to sell AAVE right away because it could fall sharply to the $50-60 zone or even deeper.

AAVEUSDT - Could Easily +200% 🚀Hi Traders, Investors and Speculators 📉📈
Ev here. Been trading crypto since 2017 and later got into stocks. I have 3 board exams on financial markets and studied economics from a top tier university for a year.
A quick look at AAVE / AAVEUSDT in this short video analysis.
From these examples, we can see that this altcoin is no stranger to parabolic mid-cycle moves:
It's important to note that even though the technical indicators Phoenix Ascending together with Fibonacci Retracement Bollinger Bands seem very bullish , it's not usually a straight line up. This progress is followed by some corrections and pullbacks during a bull market.
Other Crypto Markets :
💥 Overall, most crypto remains in a tight range between local support and resistance zones
💥 Bitcoin BTC reclaims $20500 resistance zone
💥 Ethereum ETHUSDT reclaims $1200 as it follows BTCUSDT up
💥 Cardano ADAUSDT trades lower, moves back towards .40c support zone
💥 DOTUSDT Polkadot looks ready to try $7 resistance zone
_________________
👀 Follow us here on TradingView for daily updates and trade ideas on crypto , stocks and commodities 💎
👍Hit like & Follow 🔔
We thank you for your support !
CryptoCheck

AAVE - weakness confirmed ?Looking at this setup where resistance is broke but it is actually a fakeout -> extreme weakness
I am getting short here with asks above

AAVEUSDT 1D Buyers are trying to break the downward trendToday, the trading pair AAVEUSDT is on review
From May 2021, when the price of AAVE recorded its maximum of 668 dollars, a downward trend began, which has been going on for more than a year.
In the last trading month, AAVEUSD buyers have been trying to break the downward trend. The struggle between buyers and sellers began on increased trading volumes, and the rebound from the bottom was +80% at that moment.
But there is still a lot of work, because only in the downward channel the range of price movement is 250%
In the coming days, we allow the possibility of continued growth to $89-95 , and possibly even to 115dollars per AAVE.
At these price levels, sellers should become more active in the future in order to force buyers to fight for the middle of the downtrend channel and show who currently has more strength and capital.
Well, depending on the results of this battle, the blue or red price route will be activated, you just have to watch carefully.
_______________________________
Since 2016 , we have been analyzing and trading the cryptocurrency market.
We transform our knowledge, trading moods and experience into ideas. Each "like under the idea" boosts the level of our happiness by 0.05%. If we help you to be calmer and richer — help us to be happier :)

AAVE USDT SHORT SWING | AAVEUSDT | SHORT @ 80 - 78 | TP @ 77, 76, 75, 74, 73 | SL @ 90 | PATTERN = SHOOTING STAR | BINANCE |
Swing trade idea. Kindly follow targets and stop loss. Will update with new targets once all 5 are achieved.
BINANCE:AAVEUSDT BINANCE:AAVEUSDTPERP KUCOIN:AAVEUSDT COINBASE:AAVEUSD BINANCE:AAVEUSD FTX:AAVEPERP FTX:AAVEUSD COINEX:AAVEUSDT BINGX:AAVEUSDT BYBIT:AAVEUSDT

Aave Strongly Bullish | Fast Price Appreciation Possible Now!Aave is right now in a much better position when compared to Bitcoin and Ethereum, but why?
While the King and Queen of crypto move to conquer EMA10, Aave vs Tether (AAVEUSDT) is already growing above EMA50, which can lead to massive gains.
EMA50 is the magenta line on this chart.
Price set at $79.78.
AAVEUSDT closed yesterday above this price and we can also see the volume breakout with the RSI at 64 being very strong.
All that remains is to be patient to see more growth.
For your convience, I mapped some targets on the chart.
Notice we have here also the "same pattern", the low followed by lower low... Oh ok, you already know.
Namaste.

AAVE 🇬🇧- Be Careful Now 💂Yes most likely DEFI and ALTS altogether will follow Bitcoin but not necessarily:
Our chart shows resistance for AAVE and i would prefer to buy lower or higher over 78,5$ (SL at 74 in this case)
That's me and my humble opinion.
One Love,
the FXPROFESSOR

EW playHere is a EW analysis that can help in seeing potential reversal on AAVE when last rally is complete. Volume tried to break the parallel channel on OBV but failed, that indicates positive volume failed, and more likely to see negative volume.


AAVE - Unclear at ResistanceAAVE had to follow the market altogether and has dipped lower under resistance.
At this stage the chart is unclear and a dip would be more probable unless BTC can rise over 20670$
I would rather buy in again a bit lower at 68 or even 57$ or higher, over resistance at 78$
Welcome to trading.
One Love,
the FXPROFESSOR
PS. Still holding half my position from 60.30$

#AAVE BULLISH STILL. Target 2 MET. Retest of Funnel breakoutLooks like a great re-entry spot with defined exit points if things turn south on the macro and #BTC
But I suggest we have a still a legitimate opportunity of going and meeting it's final target.
AAVEUSDT SHORT POSITIONCurrency Analysis AAVE Sell Position time frame 2H
It is not a recommendation to buy or sell

AAVE 🇬🇧- Breakout and off to 110$ ? 💂💷We saw it coming and it happened:
AAVE did come back in an emphatic way but our first target has been hit, which means we are taking half profit just now while another half of our position remains open.
the head of growth and partnerships at Aave companies Christina Beltramini during the NFT.NYC in June to discuss the intentional growth trajectory of Lens, social graphs in the era of Web3 and the future of content creation.
After working for the likes of JPMorgan and Tidal, Beltramini assumed the role of global business development of music partnerships at prominent social media platform TikTok in mid-2019.
It was during this time she witnessed what she described as an innate lack of autonomy and bureaucratic constrictions that TikTok content creators experience when using the platform, most notably during the frequent requests to reinstate mistakenly deactivated accounts.
The evolution of Web3, coupled with her intrinsic desire to support the artistic expressions of content creators, was enough to convince Beltramini to pursue contributions toward a decentralized social future.
Over the last few years, the industry has witnessed the emergence and adoption of digital identity services such as Ethereum Name Service (ENS) domains, Solana Name Service domains and NFT.com, among others. Beltramini shared her thoughts on how the profile aspect of Lens Protocol compares and differs from those examples:
“Name services don’t connect wallets to wallets or social signals. With ENS, I will know what your wallet is and I’ll be able to transfer to you, but I won’t actually be able to see the connections within your wallet. So, with Lens, your profile’s an NFT, when you follow someone, that’s an NFT as well. And that’s what ties the association together.”
Profile NFTs are one of the core components of the Lens model. Issued to an individual’s wallet address, they aim to serve as a Web3 headquarters of sorts, enabling self-custody of data, the ability to publish authentic pieces of content on-chain, and built-in governance capacities should users wish to construct their own DAO.
AAVE is DEFInitely in our Liking and has potential for amazing growth.
One Love,
the FXPROFESSOR

#AAVE in bullish HVF. $80 target 2 . $100 target 3@TheCryptoSniper
I believe we are seeing a relief rally and the beginnings of positive momentum entering the #crypto space.
Yes the macro headwinds are still present. But the last two weeks has brought further bad news which the market is absorbing and ignoring,
The biggest development of this last Bull cycle is #Defi and automated market makers popularized by #Uniswap & AMM aggregators like 1 inch
One of the survivors of #Defi Ice age is #AAVE which has survived and I believe will thrive going forward.
Aave Macd
* None of what i write here is not an investment advice. Please do your own research before investing in any digital asset.
* Never take my personal opinions as investment advice, you may lose your money.

AAVE USDT LONG SWING | AAVEUSDT | LONG @ 69 - 71 | TP @ 72, 73, 74, 75, 76 | SL @ 60 | PATTERN = ASCENDING TRIPLE TOP BREAKOUT | BINANCE |
Swing trade idea. Kindly follow targets and stop loss. Will update with new targets once all 5 are achieved.
