Aave/Btc midterm scenarioGreat Project, Great R/R.
Stop loss: monthly candle closure below 2800.
Tp1: 0.0063
Tp2: 0.0102
DYOR.
Aave

AAVE Entry Range, Take Profits and Stop LossAAVE/USDT
Entry Range: $87 - 95
Price Target 1: $115
Price Target 2: $145
Price Target 3: $171
Stop Loss: $64

AAVE PERSONAL ANALYSIS IN THE LONG TERM (UPDATED)The chart for AAVE shows increasingly concerning downtrend movement which will continue later on even more as BTC is more likely to tank towards 20,000$. Please be advised to always manage your risks and only consider buying alts more in a confirmed bull market, buying alts in a bear market would most likely submit to panic selling similar to what happened with LUNA. The recommended action for this coin is to SHORT.
Longing at 50$ would prove a little risky so be warned on a potential free-fall.

Market is coming back“Be fearful when others are greedy, and greedy when others are fearful.” - Warren Buffett
Shorts are closing out on BTC & ETH. We are seeing RSI at extremely low points, historically speaking, for most crypto assets. If you look back at the history of BTC you will see dips. Some so long they are considered "bear markets" or "crypto winters". Personally, I think crypto has evolved beyond those phases. When we see downtrends, I expect them to last less and less time going forward. This is due to a combination of factors such as institutional investors cost averaging down, retail investors hoping for a moonshot and the adoption of blockchain technology though out several sectors (public and private). Before, when we crashed nobody was there to buy it up. Today is a different story and the charts back it up.
AAVE is going to pop back up, right around the $200 mark. Set your TP & SL accordingly. Let's ride the wave!

No signalIt seems to have a small drop from this area, which is good for a short position, although it has not grown very strong, but it seems to be enough so far.
If there is a problem, I will be happy to share it with me (:

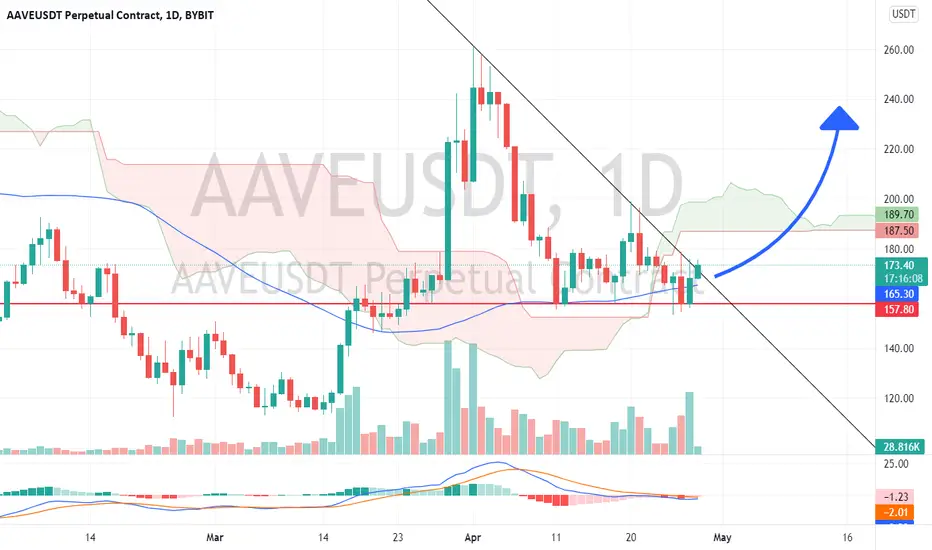
AAVEUSDT TREND LINE ANALYSISHi, everyone here.
We are a team that specializes in chart analysis.
We'll be your guide
I hope it helps you a lot
Thank you.
All of the highly reliable upward trends are broken.
Candles are located in a sharp downward trend, so it is difficult to determine whether they will go down further or rebound.
The buying RBI is when it crosses the white downward trend while riding the yellow upward trend.
Further gains should rise above the sharp green upward trend.
There are many sales stands concentrated around 85.3.

aave short aaave down trend we lossing supp
btc going down
aave btc going down
usdt going up stock going down so take advantige off this short

iHS - confluence with the OBVLooks like $AAVE is trying to put together an inverted head x shoulders which seems in confluence with the OBV.

AAVEUSD - Down Channel EntrySimilar scenarios can be seen along this down channel on AAVEUSD
Both resistance turned support lines (yellow) are parallel

AAVE Spot Zones“In order to be successful, you have to make sure that being rejected doesn't bother you at all.”
-- Bill Ackman

Aave Protocol (AAVE) Buy ZoneAave Protocol (AAVE) Buy Zone
--------------------
BIAS
Mid-Term : Bullish
Risk : High
Aave Protocol has once again been rejected from $140 mid-term resistance zone. This could be the refueling it needed before a move up.
--------------------
$AAVE/USDT LONG SETUP
Leverage : x3 - x5
Entry Price : 141 - 138
TP 1 : 144.4
TP 2 : 148.8
TP 3 : 158.5
TP 4 : 164.3
TP 5 : 169.7
TP 6 : 174.3
TP 7 : 182.2
TP 8 : 187.5
Stop Loss : 134.9
*Maximum 3% of Portfolio.
*Unload 12.5% at each TP. Whenever TP 2 hits, Move stop loss to entry.
--------------------

AaveAave Technical Analysis basically on elliott waves Principles and Priceaction Strategy
Aave can be 667$ again
Wait and watch.

AAVE/USDT : Reached the S/R zone and trendline!BINANCE:AAVEUSDT
Hello everyone 😃
Before we start to discuss, I'll be so glad if you share your opinion on this post's comment section and hit the like button if you enjoyed it!
$AAVE has reached the trendline's resistance now and also there's a formed S/R zone.
So basically it's a bearish sign and we have to expect the rejection...
But there are not enough levels to set our Short position here!
The Short position should be located below $148.5!
After all; There can be a chance of a breakout above the mentioned trendline and S/R zone.
If we get the closings above the S/R zone and trendline, Then we locate our Long towards $190.5!
Trading setup :
🔻 Entry Pointes : $155 - $157.5 - $160
📍Targets : $164 - $169 - $174.5 - $181 - $190.5
🟥 Overall stop-loss : $148.5 ( Three Candles Close )
⚠️ It's not activated yet, Needs to wait for a proper breakout!
Hope you enjoyed the content I created, You can support us with your likes and comments!
Attention: this isn't financial advice we are just trying to help people with their vision.
Have a good day!
@Helical_Trades

AAVE is going to reach 350$AAVE has Formed an Inverse Head and Shoulder Pattern. This means the Price is gonna Increase! This pattern is a Bullish Pattern and we can Be Sure of Good Bullish Stuff! The Right Shoulder Has not been Fully Created! When It's Completed and Reached the Neckline, we can Expect a Bullish Movement Up to 350$. There is also a Regular Bullish Divergence (+RD) On MACD which means the Bullish Chance Is Pretty High! You can Enter AAVE right now But It's a Bit Risky. If you wait Until It Reaches The Neckline, It is Perfectly Safe For Entering.
_ _ _ _ _ _ _ _ _ _ _ _ _ _ _ _ _ _ _ _ _ _ _ _ _ _ _ _ _ _ _ _ _
Thank you for seeing idea .
Have a nice day and Good luck

$AAVE 140 Support Zone$AAVE recently testing that 140 support over the past few days, seeing sellers near close here, and will need buyers hard tonight/tomorrow if it wants to hold.
RSI already broke the support, but I don't treat diagonals with much validity.
Either way, with the overall market trend, it doesn't look hot. 112 is the next very clear support, could see some action in the 125 area.

AAVE/USDTFor the people that are risk addicts. Trading on price range is more safe than the position. Do NOT obstinate with stops.

AAVE - Simple chart with two clear possibilitiesLike and follow us for more free technical analysis.
Picture speaks more than words
All the details on the chart.
Cheers
GreenCrypto Team

Pump after fallingAfter a sharp drop and being aligned with the fork and reacting to its lines, This token is now in a critical range that if it can not be supported by the specified lines and ranges, there is a possibility of further drop. But it is expected to be ready to move upwards after falling below the support and suffering range Of course, all these descriptions depend on the king of crypto, Bitcoin If you have any comments or criticisms, I will be happy to share them with me. In addition, I invite you to see the SLP analysis. In this analysis, the worst possible conditions are considered

AAVE tradesame as always, just going off the liq levels. theres about one at 154ish but i placed SL below, there are a couple bubbles that need bursting at the 170s-180s marks
Happy Trading Fellas!

AAVE W PATTERN IS LOADINGI have became bullish on AAVE after Elon musk appoints AAVE's founder as Twitter Interim CEO.
The H&S might be valid after a break below it's neckline and this W pattern will be invalid as price will go down hard.
Anyway; keep watching $BTC for a confirmation.

AAVE is in a Bearish Pattern But can It Become Bullish?AAVE is in a Descending Triangle. this means the price is going to Decrease (Probably) But a Thing That Must be Noted is that There is a Regular Bullish Divergence (+RD) Visible On MACD Which means the Price Can Increase.a Break out Is about to Accrue too.So there IS a Chance For Price to Increase Back to the Top Of The Triangle.
_ _ _ _ _ _ _ _ _ _ _ _ _ _ _ _ _ _ _ _ _ _ _ _ _ _ _ _ _ _ _ _ _
Thank you for seeing idea .
Have a nice day and Good luck

AAVE LONG SIGNALNice to meet you, everyone
I'm an alt trader
I'm analyzing and recommending things that are similar to my personality among many alt coins
It shows that the downward wedge has been broken.
Expect to be retested and highly likely to go up
AAVE/USDT easy 30% profit in May/2022AAVE/USDT:
1/ Bullish Divergence happening on MACD histogram (1D)
2/ Bullish Divergence happening on Stoch RSI (1D)
3/ Price retest trendline after breakup descending falling wedge 1D and 4H
=> Target take profit about 238 USD at the resistance trendline.
