AAVE 2.5 Month Trendline Breakout Calls for a ReversalAAVE was the best performing crypto in the last 24 hours, gaining almost 13%. AAVE's gains are no coincidence, coming as the result of a classical trendline breakout signal that has the potential to signal a bottom.
Trendline Breakout
This is a fairly notable trendline, both because of its age and because it connects all the peaks printed in 2022. The breakout can signal a major shift in the market sentiment, but the bulls still need to clear the next major hurdle that comes around the $150 – $159 SR zone.
RSI Momentum
Yesterday was a big reversal day that was followed by a break of the RSI oscillator above the 50 mid-level. In mid-January and at the beginning of February, we had two failed attempts to break above the RSI 50 level.
However, the sizeable bullish candle printed yesterday can signal that the outcome would be different this time.
Looking forward: If the bulls manage to clear the $150 big psychological number, it will open the door for a possible test of the 0.382 Fibonacci retracement level, which perfectly aligns with February's peak. Ideally, we want the RSI oscillator to hold above the 50 mid-level to increase the chance of the current rally to extend.
Aave

💡Don't miss the great buy opportunity in AAVEUSD @AaveAaveTrading suggestion:
". There is a possibility of temporary retracement to the suggested support line (137.2).
. if so, traders can set orders based on Price Action and expect to reach short-term targets."
Technical analysis:
. AAVEUSD is in a range bound, and the beginning of an uptrend is expected.
. The price is above the 21-Day WEMA, which acts as a dynamic support.
. The RSI is at 78.
Take Profits:
TP1= @ 147.7
TP2= @ 172.5
TP3= @ 191.4
TP4= @ 220.8
TP5= @ 240.9
SL= Break below S2
❤️ If you find this helpful and want more FREE forecasts in TradingView
. . . . . Please show your support back,
. . . . . . . . Hit the 👍 LIKE button,
. . . . . . . . . . Drop some feedback below in the comment!
❤️ Your support is very much 🙏 appreciated!❤️
💎 Want us to help you become a better Forex / Crypto trader?
Now, It's your turn!
Be sure to leave a comment; let us know how you see this opportunity and forecast.
Trade well, ❤️
ForecastCity English Support Team ❤️

💡Don't miss the great buy opportunity in AAVEUSD @AaveAaveTrading suggestion:
". There is a possibility of temporary retracement to the suggested support line (137.2).
. if so, traders can set orders based on Price Action and expect to reach short-term targets."
Technical analysis:
. AAVEUSD is in a range bound, and the beginning of an uptrend is expected.
. The price is above the 21-Day WEMA, which acts as a dynamic support.
. The RSI is at 78.
Take Profits:
TP1= @ 147.7
TP2= @ 172.5
TP3= @ 191.4
TP4= @ 220.8
TP5= @ 240.9
SL= Break below S2
❤️ If you find this helpful and want more FREE forecasts in TradingView
. . . . . Please show your support back,
. . . . . . . . Hit the 👍 LIKE button,
. . . . . . . . . . Drop some feedback below in the comment!
❤️ Your support is very much 🙏 appreciated! ❤️
💎 Want us to help you become a better Forex / Crypto trader ?
Now, It's your turn !
Be sure to leave a comment; let us know how you see this opportunity and forecast.
Trade well, ❤️
ForecastCity English Support Team ❤️

Aave (AAVE) - March 17Hello?
Traders, welcome.
If you "follow", you can always get new information quickly.
Please also click "Like".
Have a good day.
-------------------------------------
(AAVEUSDT 1D Chart)
(Full: )
In order to get out of the mid- to long-term investment area, it should rise to the 148.0-187.7 range to receive support.
To turn into an uptrend, it needs to move higher around 187.7.
The primary resistance section is around 267.2.
The next volatility period is around April 4-13.
--------------------------------------
(AAVEBTC 1W chart)
Above the 0.002157-0.002829 interval: expected to continue upward trend
The price must rise above 0.003928 to maintain the upward trend.
------------------------------------------------------------ -----------------------------------------------------
** All indicators are lagging indicators.
Therefore, it is important to be aware that the indicator moves accordingly with the movement of price and volume.
However, for convenience, we are talking in reverse for the interpretation of the indicator.
** The MRHAB-O and MRHAB-B indicators used in the chart are indicators of our channel that have not been released yet.
(Since it was not disclosed, you can use this chart without any restrictions by sharing this chart and copying and pasting the indicators.)
** The wRSI_SR indicator is an indicator created by adding settings and options to the existing Stochastic RSI indicator.
Therefore, the interpretation is the same as the traditional Stochastic RSI indicator. (K, D line -> R, S line)
** The OBV indicator was re-created by applying a formula to the DepthHouse Trading indicator, an indicator disclosed by oh92. (Thanks for this.)
** Support or resistance is based on the closing price of the 1D chart.
** All descriptions are for reference only and do not guarantee a profit or loss in investment.
(Short-term Stop Loss can be said to be a point where profit and loss can be preserved or additional entry can be made through split trading. It is a short-term investment perspective.)
---------------------------------


AAVE/USDT - Potential 294% SetupHello Traders!
AAVE is completing its previous market cycle. The price is approaching the $59 - $93 buy zone
We can accumulate medium-term purchases with a favorable risk/profit ratio closer to the support level of $59. A grid of orders can be placed in the range of $59 - $74
The targets will be price levels of
$147
$231
$298
Good luck and watch out for the market
P.S. This is an educational analysis that shall not be considered financial advice

AAVE, LOOKING TO SEE SPECIAL SUPPORT !?
__________________________
Here we have AAVE that is reaching a significant support area. Sounds good to add some AAVE to our wallet... (>_-)

Aave bull divsaave is looking great to accumulate down here,
could potentially be close to breaking the down trend

AAVE'S FALLING WEDGE IDEAMy plan for AAVE: Buy below 120; sell 100% at 230-250 range; then wait for retest of falling trend, buy at marked zone 2, sell 80% at TP1, try to sell the remaining 20% at TP2 if it looks it can get there, hope idea works!.
Please let me know what you guys think.
Thanks


aave looking goodaave is looking great to accumulate down here,
could potentially be close to breaking the down trend

AAVE to $250 🤑Hey Traders,
As you can see on the Daily Candles of Aave (AAVE), the price action has formed a beautiful falling wedge (lower lows and lower highs.) The price target out of this would be 70-80% ($250). Additionally, there is a massive bullish divergence! Get ready...
Safe Trading
-Pulkanator

AAVE with possible W-shape pattern - target $200AAVE with possible W-shape pattern - target $200
Therefore a break above $150 with conformation has to occur.
Fundamental:
Number of long-term HODLer (blue graph) rising >> trust in this Crypto.
What do you think?
Drop me a nice comment if you'd like me to analyze any other cryptocurrency.
*not financial advice
do your own research before investing

AAVE/USDT Bullish after pullbackBullish on AAVE. We can see a falling wedge pattern forming on the daily timeframe, with nice bounces between the pattern.
Furthermore, we are able to see a Bullish MACD on the 4hr timeframe. Wait for this to happen on the daily timeframe for a signal to buy.
In this suggestion, we recommend to not wait for price to break out at the falling wedge, but to take profit for the trending wave upwards.
Trade setup:
Entry: 115
S/L: 102
Target: 160


Looking at AAVE..Guys some thing happen in AAVE token,
that's point that 50.30% increase in volume at 24h ago; with some analyze we reach that it's good to have some.
It just a guess not recommend to you; just think...
be patient :)

Buy AAVE on the 15 Minute chartAAVEUSDT looks like a nice quick buy based on current market trends for a quick trade entry. Take profits as mentioned.

AAVENot financial advice.
The essence of investing & trading is the intelligent and patient preying on the greed, fear, impatience, addiction and ignorance of the majority. It's definitionally Darwinian.

AAVE - long ideaThe structure marked on the chart is a complex corrective pattern, in my opinion, that may be almost complete.
Last wave taking the form of an ending diagonal.
If this assumption is valid, we will observe the move to test the ATH very soon.
Trade safe!

Trade idea on AAVE/USDTI expect that the correction is about to end and we targeting a new high for wave iii, our idea is to long in this pullback actually at 61.8% of wave i
invalidation at 157.6

Aave Protocol (AAVE) Buy ZoneAave Protocol (AAVE) Buy Zone
--------------------
BIAS
Mid-Term : Neutral
Long-Term : Bullish
Risk : Medium
After a 80% correction from it’s all time high, it's reached a short-tern support zone that will more than likely hold all the remaining bottom shorters in the market.
--------------------
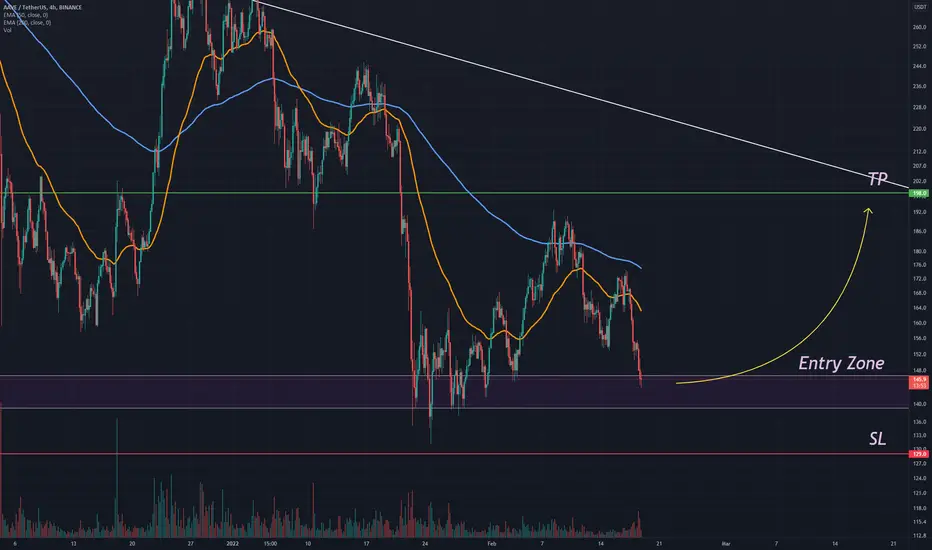
$AAVE/USDT LONG SETUP
Leverage : x3 - x5
Entry Price : 139 - 146.5
TP 1 : 150.5
TP 2 : 156.5
TP 3 : 162.5
TP 4 : 168
TP 5 : 173
TP 6 : 180
TP 7 : 186
TP 8 : 198
Stop Loss : 129
*Maximum 3% of Portfolio.
*Unload 12.5% at each TP. Whenever TP 2 hits, Move stop loss to entry.
--------------------