(Update) AAVE/USDT on the way to 400$Hi every one
AAVE / TETHERUS
AAVE/USDT has Managed to Break the Symmetrical triangle which It was In and Now the Road To 400$ is Inevitable. there should Be a Correction before It fully completes It's Bullish Movement.
Summery:
-AAVE has broken the Symmetrical Triangle
-AB=CD so It can Reach 400$ Easily
-a correction is Expected before the 400$ is reached.
Previous Analysis:
💎Traders, if you liked this idea or have your opinion on it, write in the comments, We will be glad.
Thank you for seeing idea .
Have a nice day and Good luck
Aave

Aave (AAVE) - August 9Hello?
Welcome, traders.
By "following", you can always get new information quickly.
Please also click "Like".
Have a nice day.
-------------------------------------
(AAVEUSD 1W Chart)
If the price holds above the 206.817161 point, it is expected that the uptrend will continue.
(1D chart)
If the price holds at the 315.356387-419.933 section, we expect it to move up to the 419.933-472.221304 section and re-determine its direction.
Accordingly, it must rise above the 472.221304 point to continue the uptrend.
If it falls in the 300.459751-315.356387 section, you can touch the 158.491471-210.779774 section, so Stop Loss is required to preserve profit and loss.
-------------------------------------
(AAVEBTC 1W chart)
If the price holds above the 0.004956-0.005734 range, we expect the uptrend to continue.
(1D chart)
If the price holds in the range 0.007364-0.009798, I would expect it to move up to the range 0.009798-0.011016 and re-determine.
Accordingly, to continue the uptrend, it must rise above the 0.011016 point.
If it goes down, you should check to see if it finds support in the 0.006650-0.007865 range.
If it falls from the 0.006650 point, you can touch the 0.003712-0.004930 section, so you need Stop Loss to preserve your profit and loss.
------------------------------------------
We recommend that you trade with your average unit price.
This is because, if the price is below your average unit price, whether it is in an uptrend or in a downtrend, there is a high possibility that you will not be able to get a big profit due to the psychological burden.
The center of all trading starts with the average unit price at which you start trading.
If you ignore this, you may be trading in the wrong direction.
Therefore, it is important to find a way to lower the average unit price and adjust the proportion of the investment, ultimately allowing the funds corresponding to the profits to regenerate themselves.
------------------------------------------------------------ -----------------------------------------------------
** All indicators are lagging indicators.
Therefore, it is important to be aware that the indicator moves accordingly with the movement of price and volume.
However, for the sake of convenience, we are talking in reverse for the interpretation of the indicator.
** The wRSI_SR indicator is an indicator created by adding settings and options to the existing Stochastic RSI indicator.
Therefore, the interpretation is the same as the traditional Stochastic RSI indicator. (K, D line -> R, S line)
** The OBV indicator was re-created by applying a formula to the DepthHouse Trading indicator, an indicator disclosed by oh92. (Thanks for this.)
** See support, resistance, and abbreviation points.
** Support or resistance is based on the closing price of the 1D chart.
** All descriptions are for reference only and do not guarantee a profit or loss in investment.
Explanation of abbreviations displayed in the chart
R: A point or section of resistance that requires a response to preserve profits.
S-L: Stop Loss point or section
S: A point or section where you can buy to make a profit as a support point or section.
(Short-term Stop Loss can be said to be a point where profit and loss can be preserved or additional entry can be made through split trading. It is a short-term investment perspective.)
GAP refers to the difference in prices that occurred when the stock market, CME, and BAKKT exchanges were closed because they are not traded 24 hours a day.
G1 : Closing price when closed
G2: Opening price
(Example) Gap (G1-G2)


Aave AAVEUSDT - Impulse Elliott wave + ALL TIME HIGH soon!- Aave is an Open Source and Non-Custodial protocol to earn interest on deposits and borrow assets.
- Current rank 27 on coinmarketcap + Volume 24h $651,835,502.
- This is my Elliott wave count - we are currently in the Impulse wave to the upside!
- Next target is 0.618 trend-based fib extension for fifth wave.
- For expected duration of the trade, probability, stop loss, profit target, entry price and risk to reward ratio (RRR) - please check my signature below ↓
- If you want to see more of these ideas, hit "Like" & "Follow"!

AAVEUSDT After the Pullback Will Go Up
Welcome back Traders, Investors, and Community!
AAVEUSDT on H4 in the Bullish channel after the pullback will go up
⬆️Buy now or Buy at 336
⭕️SL @ 300
✅TP1 @ 386.17
✅TP2 @ 415.82
✅TP3 @ 479.48
Check the Links in Description and If you LIKE this analysis, Please support our page and Ideas by hitting the LIKE 👍 button. ❤️ Your Support is really appreciated! ❤️
Traders, if you have your own opinion about it, please write your own in the comment box. We will be glad for this.
Feel free to request any pair/instrument analysis or ask any questions in the comment section below.
We will have more FREE forecasts in TradingView soon
Have a Profitable Day

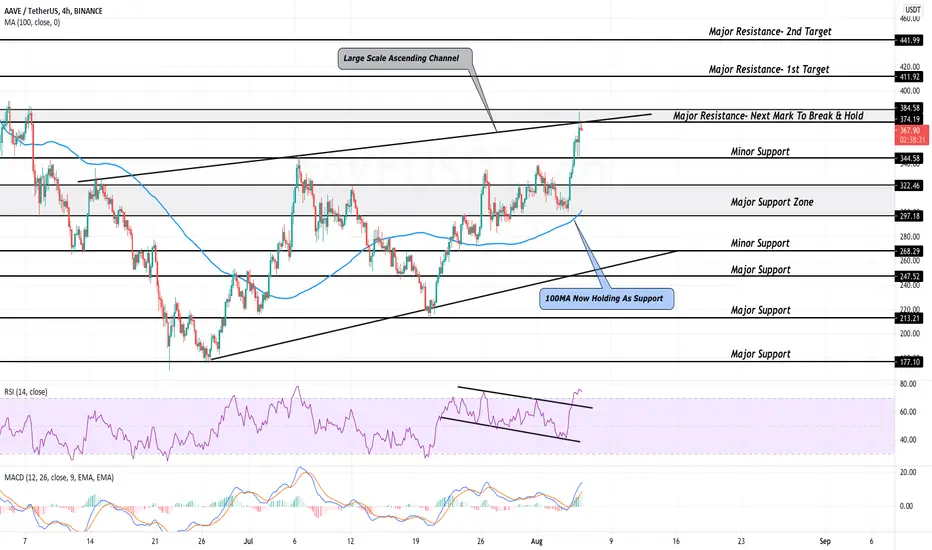
AAVE Breaks Multi Month Resistance, Is More Upside Coming?-AAVE has risen over 25% the last week
-Price has finally cleared multi month resistance
-Bulls are firmly holding the 100MA
AAVE has finally shown some strength after months of being stuck below the $350 resistance. The overall cryptocurrency market seemed to push higher after news that the scheduled “London” upgrade occurred on the Ethereum blockchain. AAVE is one of the top DeFi coins and has experienced mind blowing gains over the last two years. One can only imagine a similar story to occur once steam is gained throughout the market.
Over the last 6 weeks, AAVE has continuously printed higher lows and higher highs. This is the type of evidence needed for us to assume AAVE has entered some type of bull trend after months of downtrending. At the time of writing, price has kissed the top trend line of a near 2 month large-scale ascending channel. This has rejected price two other times and may continue to be the case. For AAVE to fully clear this trend, price must break & hold the major resistance zone found at $374-$384.
Just over 12 hours ago, AAVE wicked to its minor support of $344. We can now safely assume this is a short term floor for bulls. In the likely event of a rejection at the top trend of the channel, we can expect prices to sweep back to this value. Below this mark lies the 100MA & a major support zone ranging from $297-$322. The 100MA has been holding prices for over 2 weeks now. Breaking below this mark will trigger a short term downtrend.
While looking at the relative strength index, we can see how strength just blasted out of a 2 week bull flag. This allowed price to reach a multi month high. Since the RSI is now overbought, we should expect a pull back soon. The MACD just bounced off the 0 value, refusing to drop into bearish territory. The histogram is now ticking down & a bearish cross on the MA’s will land AAVE back to its minor support.
AAVE Intraday Analysis
Spot rate: $369.87
Trend: Bullish
Volatility: High
Support: $344.58
Resistance: $374.19

💡Don't miss the great buy opportunity in AAVEUSD @AaveAave
Trading suggestion:
". There is a possibility of temporary retracement to the suggested support line (336.03).
. if so, traders can set orders based on Price Action and expect to reach short-term targets."
Technical analysis:
. AAVEUSD is in an uptrend, and the continuation of the uptrend is expected.
. The price is above the 21-Day WEMA, which acts as a dynamic support.
. The RSI is at 77.
Take Profits:
TP1= @ 386.17
TP2= @ 415.82
TP3= @ 479.48
TP4= @ 534.93
TP5= @ 661.20
SL= Break below S2
❤️ If you find this helpful and want more FREE forecasts in TradingView
. . . . . Please show your support back,
. . . . . . . . Hit the 👍 LIKE button,
. . . . . . . . . . Drop some feedback below in the comment!
❤️ Your support is very much 🙏 appreciated!❤️
💎 Want us to help you become a better Forex / Crypto trader?
Now, It's your turn!
Be sure to leave a comment; let us know how you see this opportunity and forecast.
Trade well, ❤️
ForecastCity English Support Team ❤️

AAVE- Outperforming most DEFIsDemand for Aave has boomed dramatically in the previous days as traders assessed its involvement in Bitwise Investment’s upcoming institutionally focused investment vehicle.
The San Francisco-based asset management firm announced Wednesday that it would invest directly in Aave to back its “Bitwise Aave Fund,” a fund created to build a bridge between accredited investors and the emerging decentralized finance (DeFi) sector.
The latest bout of uptrend pushed Aave’s year-to-date gains a little over 320%, asserting its growth in the emerging DeFi sector. In detail, Aave enables users to earn interest rates on deposits and borrow assets with a stable or variable interest rate option.
Also, Bitwise Launches Crypto Funds for Aave and Uniswap. The $1 billion digital assets manager said Wall Street-type clients are demanding more exposure to DeFi's biggest names.
For us here at FXPROFESSOR, AAVE 🇬🇧 is DEFInitely a BUY
One Love,
the FXPROFESSOR

AAVE/USDT#AAVE broke the resistance line, i think it's good opportunity for make long position on it.

AAVE Is One to Watch - 2 Potential PlaysOne on my radar for a while which I mentioned along with MATIC and ETC I would be playing with if BTC behaved. I like what I see here.
AAVE has been making a steady move up back to this previous resistance and there's only so many times a door can be kicked before it falls down.
However, with any run up (Referring to BTC) cool-offs are to be expected, so playing with patience will yield dividends if you time your entry.
We're sitting on previous resistance and we've got 2 plays. Going old school Ichi with this one as we're knocking on cloud resistance.
1/ A break inside the cloud and through this resistance would likely be quick, where if an entry is missed you could wait for a retest of the bottom of the cloud and resistance turned support
- Why? Because when the late buyers jump on board and push price, the early buyers are selling and taking profits, which can signal a short term cool off before we decide if we hold above former resistance and continue our push up. That's where you want to time your entry when things stabilize.
2/ We re-test the trend line and prepare for another push. This is a great scenario if we hold the trend line as it offers a far better entry and the chance to ride the move back up to resistance and through.
I do believe we'll get some good entries on ALTS this week and some nice plays in August, but as always... PATIENCE PAYS


AAVE - Broken Out of Inverse H/S? Looks Like Money!Here's a very nice setup for AAVE, which has some very bullish developments taking place with AAVE pro.
I expect a pretty easy payday here, though we're nearing retracement on the RSI so expect to grab a quick dip for even better gains.


Equalizer | EQZ | Mainnet | Long TAAs asked,
Long analysis,
Low RSI
Touching ascending channel
Mainnet scheduled for august, first week
Bitcoin in a better time
Equalizer | Flash Loans | AAVE
Gem | $EQZ | Long | 35%+

AAVE - Trade SetupTHis one is a trade setup.
See the first resistance area? that's the main key. if the prices manage to cross that line and close a 4H candle above it, you can open your long positions and take profits on the higher resistance lines. Be very careful with your long positions and don't get greedy.
You can also do some scalping, using the support areas but watch out for dynamic resistance ares (Look for Bollinger bands).
I'll keep this chart updated.
Current Market Price: $306.79
Good Luck
Tell me your ideas. Like and Share

AAVE Breaks & Retests 2 Month Bear Trend-AAVE revives nearly 40% off the low set this week
-Price has just broken & retested 2 month bear trend
-400 MA is holding as support
AAVE has held fairly well over the last few months compared to other DeFi coins in its class. AAVE offers a very useful technology to the crypto space and more importantly an effective decentralized finance product. This technology put simply; lending and borrowing of crypto along with interest gained by being a lender. This technology really has taken off the last year as AAVE had one of the highest percentage gain bull runs throughout the last year. It seems that AAVE is setting itself up for another strong bull trend.
Over the last couple months, prices have been consolidating hard awaiting the next move from the market. There is a large pennant formation that can be seen using the two trend lines on the chart. Just over the past few days, bulls have succeeded in a bullish breakout as prices are now attempting to confirm this trend as support. Along with this trend lies a very important resistance zone from $297-$322. Bulls must fully break & hold this zone for AAVE to be in position to hit the two targets shown.
If bears step in with vengeance, AAVE will likely drop below the top trend of this pennant and fall back to minor support of $268. At the time of writing, AAVE is trading above its 400MA. Breaking below this mark will likely confirm a slight bear trend will take place. If support of $268 fails to hold, AAVE will likely drop down to its major support of $247. Anything below this mark will be a very bearish scenario.
While looking at the RSI, we can see strength had a rally to the overbought territory. Since then, strength has been slowly consolidating back down. The RSI must stay over the 50 value to continue in a bullish trend. The MACD is signaling a slight bearish bias as it seems to be heading back to the 0 line. If the MACD breaks back into bearish territory, it’s possible AAVE revisits the lower supports that are shown.
AAVE intraday levels
Spot rate: $296
Trend: Neutral
Volatility: Medium
Support: $268
Resistance: $297

AAVEUSDT Full Bullish Mode Detected AAVEUSDT daily time frame, we can see a clean Ascending Triangle Breakout happen, and the market seems to us super Bullish right now. We are going to open a long position with a good risking price.


AAVE: Interesting level to watchHello everyone,
AAVE is at an interesting level at the moment. We have seen a 40% rise in price in the past 4 days. So what's next? AAVE reclaimed the $282 support level and reclaimed the 200MA (which is sitting at $282 as well). However, AAVE is still in it's bearish pennant it's has been forming since the late may crash. The rise in price over the past 4 days also brought the Stochastic RSI to very high levels.
This means holding the $282 support will give us a breakout of the bearish pennant, opening up the road to the $340 resistance and then the $411 resistance. Losing the $282 support however, would likely mean a drop to the $240-$245 range, maybe even to the bottom of the pennant around $230.
Where we will head will depend on Bitcoin. If BTC trades bullish in the next couple of days AAVE will probably breakout. If BTC drops, AAVE will drop with it. The biggest concern is the CME gap for BTC right now. CME futures closed at 32,200 on the 23rd so I am concerned BTC will drop come monday morning.

AAVE, Developments In Ascending-Channel, Important Zones!Hello,
Welcome to this analysis about AAVE, we are looking at the 6-hour timeframe perspectives. In my analysis, I found some interesting developments that AAVE is forming with recent bullish volatility coming up and moving to the upside after bouncing at the local support zone of 215. Besides that there is the main formation forming in which AAVE will develop further in the upcoming times and which will be the source of incoming volatilities. When considering AAVE it has the be noted that not every altcoin is building such increasing volatilities, there are also ones looking more flat or bearish while the volatility since the bounce in the structure looks solid, therefore I detected all the important levels and likely determinations we should consider with the coin.
Structural Developments:
As when looking at my chart we can watch there how AAVE has formed this major ascending-channel-formation in the structure marked with the black boundaries. Within this channel, AAVE has a coherent wave-count in which it already completed the waves A and B in the schedule and is now about to develop the main wave C to the upside in which it formed the first local wave A that recently marked above the 100-EMA in red and the 200-EMA in green which is a good sign for the continuation in this structure. Also has AAVE since moving above these important EMA-levels the ability to build a bull-flag, a bull-pennant, or a triangle-formation above these levels which inhabits the continuation pattern for the further wave-development.
Upcoming Determinations:
Taking all these factors into the consideration now AAVE has established a great structure with great volatility and is likely to continue with the wave-count in the determined ascending-channel, for now entering on the long-side should not be the best option as AAVE already increased substantially with bullish pace however there is the potential for a short when AAVE moves into the upper-wave-count-determination-zone marked in my chart in the blue level and the black box within this level, however, this zone is simultaneously resistance. In that case, everything depends on how AAVE approaches this zone of target and resistance, if it is strong or if it is weak, both developments can give indications for further movements.
In this manner, thank you for watching my analysis about AAVE and the main ascending-channel-developments forming with incoming perspectives, great when you support it with a like and follow or comment for more market insight!
Information provided is only educational and should not be used to take action in the market.
