Aave

$BTC 1, 2, or 3? Pick a path! Range is boring$BTC $ETH $QI $VSP $SUSHI $BADGER $AAVE $MATIC $ADA $XRP

AAVE/USDT- Double top detected
- Flag target signed.
*Please share your opinion on it, write in the comments.
Teşekkürler.

AAVE/USD push up in wave (V) target 830AAVE/USD - Technical analysis
context: AAVE/USD is progressing with a clear impulsive elliot waves upside move. After a long period stuck in a range AAVE is progressing towards new ATH in wave (V) with a standard target at 830.
Key element (Daily chart - log)
- MM are support at 470 (55)
- RSI is above 50%
- Graphical pull back triggered (green line)
- Elliot wave key support 470 and Target 830/905/1070
Conclusion:
No reason to don't see new ATH with this kind of configuration - however keep in mind with have a lack of data history, not easy to collect fibo accumulation.
The standard analysis of the elliot wave told us to take care approching 830 (perfect exit level before sell off), but as mentioned the lack of data can also conduct the conclusion to anticipate a larger move in extension till 905 and 1070
On our side we will exit at 820 (we bought AAVE the 30 November 2020 in the setback on MM)

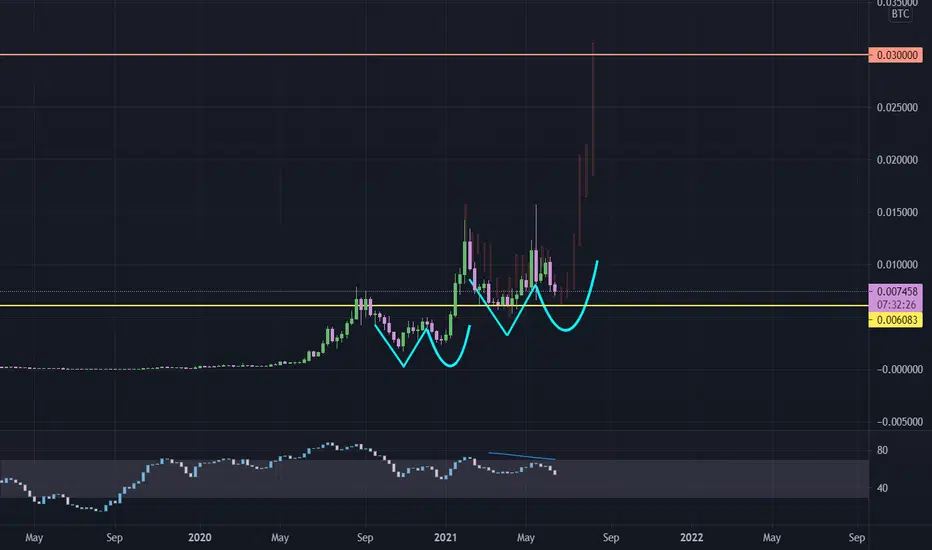
AAVEBTC adam and eve pattern#AAVEBTC
adam & eve pattern can increase price 300% to 0.03 sats
unless price won't close weekly below 0.006083 sats
AAVEUSDT ( Aave) – Coin of the Week Aave is a decentralized financial protocol that enables users to lend and borrow cryptocurrency. Lenders earn interest by depositing digital assets into specially created liquidity pools. Borrowers can then use their crypto as collateral to take out a flash loan using this liquidity. When it was debuted in November 2017, Aave (which means "ghost" in Finnish) was known as ETHLend, however it was rebranded to Aave in September 2018. AAVE acts as a governance token, allowing owners a say in the protocol's future development. It also offers holders with lower platform costs.
Technically, Aave follows the same price structure as the bigger market capitalization cryptocurrencies. We had a top in May at the price of 669 USDT per Aave, followed by a crash that created a low at 223 USDT. From the 23rd of May (the day of the low) we are in a consolidation, with the price moving between a resistance and support area. The higher probability move right now is a spike to the upside that will reach the resistance area, with or without touching the support before going up.
Trade with care.
Best regards,
Financial Flagship
Disclaimer: The analysis provided is purely informative and it should not be used as financial advice. Remember that you need a plan before you start trading; so, take this knowledge and use it as a guidebook that will ultimately help you understand the market and easily predict your next move.

This is how I make billions trading AAVE/BTC POLY MY 5150 MethodThis is how i made 78 billion yesterday, JUST GONNA HIT 100 BIILION and call it for today. Waiting for damn live accounts to get verified, I straight killed my demo account.... Deja Vu all over again, in 2017 I was using NADEX and did the same thing except they give you 10,000 demo account and I turned that in 600,000 in 5 hours just trading gold.
NADEX quickly called me the next day wondering how I was able make so much profit in 5 hours and offered me an analyst job. LMFAO I wonder if this is a record or not?
FROM $100,000 TO $100,000,000,000 IN 2 DAYS


Short - AAVEShort,
Reasons
Supply zone touched (grey box) confluent descending trendline,
Nice rejection in the top,
MSB breakout detected (in red line)
Targets and invalidation point in the chart
Risk 2%


$AAVE, Retesting 2020 yearly high level$AAVE
Retesting 2020 yearly high level
UCTS remaining bearish across the board on this asset for now (sell signals / 15% since latest 2D Sell signal)
If fails to hodl here, then looking toward ~570k sats(~25%)
Staying on the sidelines till a change on the trend happens
#AAVE

AAVE following the General trend AAVEUSDFollowing what most cryptos are doing right, AAVE seems to wan to go lower locally. We are noting Wave A of the next ABC fractal forming. Not much to note here - other than that the Fibonacci goals is in green, cancellation/setup rejection is in red. This is not some kind of financial advice for your portfolios, so do your own research and make your own decisions about your trading or investment related moves.

💣🤑 HUNT GOOD OPPORTUNITIES TO BUY AAVE !! 🤑💣With the breaking of the strong and sensitive resistance 358, there is a possibility of price growth up to the range of 395-395.
Otherwise, with the price falling below the support range of 315-325, there is a possibility that the price will fall until further support.
good luck 😉

AAVEUSDT IS STILL IN CORRECTIN!!AAVEUSDT cerection is not finished yet and need to go more down and then recover itself.
the target is shown in the chart, we consider 2 target, if tg1 break tg2 will be enabled.
Good luck guys, stay SAFE.


