AAVE IS VERY BULLISHFrom the place we inserted "start" on the chart, it looks like a diametric has started.
Wave D seems to be a diametric, and only wave g is left of this diametric. In the coming days, with the completion of wave g from D, the bullish wave E is expected to start.
By maintaining this range, it is expected to move towards TPs.
Closing a daily candle below the invalidation level will violate the analysis.
For risk management, please don't forget stop loss and capital management
When we reach the first target, save some profit and then change the stop to entry
Comment if you have any questions
Thank You
Aavebtc

AAVE/USDT probability of bullish continuation from demand? 👀🚀💎 Paradisers, brace yourselves for a captivating chapter in the #AAVEUSDT saga, with signs pointing to a bullish breakout from its current stronghold.
💎 After facing resistance in a tough supply zone, #AAVE has intriguingly navigated through buyer territory. This maneuver hints at a potential dip before embarking on a bullish trajectory from the key demand level of $106.06. A surge of bullish energy here could propel EURONEXT:AAVE towards a significant challenge against the looming supply zone overhead.
💎 In the ever-shifting crypto arena, flexibility in strategy becomes paramount. If #AAVE stumbles at this critical juncture, adapting swiftly could be our ace in the hole.
💎 Enter Plan B: eyeing a bullish charge from a deeper demand level at $98.56. This becomes our vigil point, where a breach might signal an early transition to bearish trends for #AAVE. 🌴💰

AAVE/USDT Bracing for a Bullish Swing Amid Downward Pressure? 💎 Paradisers, get set for an engaging trading setup with #AAVEUSDT. Despite a current dip, there's a bright spot on the horizon for a bullish pivot from the demand zone.
💎 Tracking #AAVE's recent slide, we've clocked a hefty 36% tumble from its zenith. However, as it approaches a key demand zone at $74.64, there's a stirring chance for a spirited bullish rally if it can cling to this momentum, aiming to breach a hefty supply zone above.
💎 The plot thickens if the price slides under $81.58. Gear up for a potential 9.20% gain before #AAVE reaches our targeted demand zone. Keep a sharp eye out; a descent past $74.64 would be our cue for a tactical shift in approach.

Candle of breaked(AAVE)❤️❤️Thanks for boosting 🚀 and supporting us!
📈When I am in a reng and that reng is broken with a powerful candle, I can decide to follow the same process from the broken side, and AAVE has exactly the same conditions.
📊 (Entry) : 119.57
🔴 Stop Loss : 111.34
🎯 Take Profit : 125-131-138-144
🔗 For more communication with us, In the footnote and send a message in TradingView.
👨🎓 Experience and Education: Our trading team has five years of experience in financial markets, especially cryptocurrencies.

AAVEUSDT 1D LONG📈Hi all. AAVEUSDT has been forming a wedge for 1.5 years. I consider a long break/retest. Depending on your type of trading, it is possible to set up in spot and trade inside the wedge. Marked targets and levels on the chart.

AAVEUSDT Good Buy!AAVEUSDT - Buy Setup!
AAVEUSDT (Weekly Chart) Technical analysis
AAVEUSDT (Weekly Chart) Currently trading at $83.4
Buy level: Above $80
Stop loss: Below $60
TP1: $94.00
TP2: $115
TP3: $170
TP4: $260
Max Leverage 2x or spot
Always keep Stop loss
Follow Our Tradingview Account for More Technical Analysis Updates, | Like, Share and Comment Your thoughts (1D Chart) Technical analysis

AAVEUSDT 150% Potential!AAVEUSDT Technical Analysis Update
Buy zone : Below $82.50
Stop loss : $72.60
Take Profit 1 : $91.50
Take Profit 2 : $116.00
Take Profit 3 : $144.00
Take Profit 4 : $195.00
Always Keep Stop Loss
Thanks
Hexa

AAVE Next Support & ResistanceAAVE Next Support & Resistance
55.13252456
62.2408754
66.57717465
73.20067885
81.39141304
93.48252256

Will AAVE extend the recovery?AAVE has reclaimed a previously invalidated daily bullish order block of $66.45 - $70.70 (red) and a support zone in July. The move could present extra gains to bulls if it’s defended.
Entry: $69
Take-profit: $75
Exit: $66.15
RR: 2
A drop below the July support will invalidate the bullish bias.

AAVE short setup After the breaking of dynamic resistance and formation of bullish CH, this symbol has moved up. It is now close to an order block. This block order is fresh and unused. You can look for sell/short positions in the red box.
I specified the targets. When we reach the first target, save some profit and then change the stop to entry
I specified the invalidation level, closing a 4-Hour candle above this level will violate the analysis.
For risk management, please don't forget stop loss and capital management
Comment if you have any questions
Thank You

Area to break upward: 64.256-65.37Hello?
Hello traders!
If you "Follow" us, you can always get new information quickly.
Please also click “Boost”.
Have a good day.
-------------------------------------
(AAVEUSDT chart)
The key is whether the price can be maintained by rising above the 64.256-65.37 range.
The 64.256 point corresponds to the volume profile section of the 1W chart.
(1D chart)
I don't see any major support or resistance points.
Accordingly, if it rises above 85.7 among the currently formed support and resistance points, it is expected to show a full-fledged upward trend.
The HA-Low indicator and the MS-Signal indicator are rising and are showing signs of continuing to rise further.
Accordingly, if the price remains above 58.35, it is expected to lead to a move above 75.22.
What is important is whether it can break upward through the 64.256-65.37 range mentioned before on the 1W chart and 1M chart.
-------------------------------------------------- -------------------------------------------
** All explanations are for reference only and do not guarantee profit or loss in investment.
** Trading volume is displayed as a candle body based on 10EMA.
How to display (in order from darkest to darkest)
More than 3 times the trading volume of 10EMA > 2.5 times > 2.0 times > 1.25 times > Trading volume below 10EMA
** Even if you know other people’s know-how, it takes a considerable amount of time to make it your own.
** This chart was created using my know-how.
---------------------------------

AAVE - Fast Recovery IdeaAn idea showing some curved trend lines on AAVE
Posing that the reversal occurs very promptly with the recent formation of the inverted H&S along the bottom diagonal
Pushing AAVE 1000+
Vertical dotted line is the middle point between the bear and the forecasted bull move

The price hit the $90 resistanceYesterday also following the buying pressure created in the market, the price hit the $90 resistance, and if the support continues in the market and this resistance is broken with a strong bullish candle, the potential for further growth and movement toward the target. Next, it will be created in the resistance range of 100 to 106 dollars. This resistance is also another reactive level in this chart. But the main resistance and target in the medium term are considered at the resistance level of 116 to 121 dollars. The current resistance level is identified as a strong zone. Therefore, we expect the range trend to continue this week before any movement.

AAVE READY TO BREAKOUTAAVE tested the downtrend resistance for the 4th time, but now we will approach it with different market perspective after positive economic data in the US.
#DXY is likely to bounce up from its current support but it is still down trending especially after US inflation rate decreased for the 3rd time in a row.
Please make sure to set realistic TP and SL for this setup, I recommend:
SL: below $65
TP1: $100
TP2: $115

AAVEUSDT Short Setup!AAVEUSDT Technical analysis update
Short level: Above $84.00
Stop loss : $90.00
Take Profit 1 : $79.00
Take Profit 2 : $73.00
Take Profit 3 : $67.00
Always keep stop loss
Thanks

AAVE registered a bullish candlestickLast week, AAVE registered a bullish candlestick with a not-so-large body. The resistance that the price hit and reacted to is the $91.3 range. Also, this area has exactly overlapped with the ceiling of the medium-term descending channel, which could cause the price to have a correction towards lower supports this week. A trend change is observed in the daily time frame. Therefore, a pullback supported by 71.2 to 75.9 dollars can bring a positive reaction.
But more important support is considered in the $66.5. If weakness is observed in the uptrend, given the potential for a double ceiling pattern to form in the 4-hour timeframe, if the first support is broken, the support range of The second can bring a stronger reaction. Therefore, you can consider these two supports this week, because if there is a positive reaction to these levels, another upward movement can be formed.

Can break out of the downtrend in the short term...Hello?
Traders, welcome.
If you "Follow", you can always get new information quickly.
Please also click "Boost".
Have a nice day.
-------------------------------------
(AAVEBTC 1W Chart)
It must rise above 0.003598-0.005609 to release the rising power.
-----------------------------------------
(AAVEUSDT 1W chart)
If the price holds above 78.3, it is expected to turn into a mid- to long-term uptrend.
However, shaking it up and down is expected to cause the HA-High to fall.
(1D chart)
To continue the short-term uptrend, the price needs to rise above 86.4 to hold the price.
However, since the -100 indicator is formed at the 96.2 point, it is expected that the full-fledged rise will begin only when it rises above 96.2.
The most important thing is not to fall below 64.3, below the downtrend line.
-------------------------------------------------- -------------------------------------------
** All descriptions are for reference only and do not guarantee profit or loss in investment.
** If you share this chart, you can use the indicators normally.
** The MRHAB-T indicator includes indicators that indicate points of support and resistance.
** Check the formulas for the MS-Signal, HA-Low, and HA-High indicators at ().
** HA SRRC indicators are displayed as StochRSI (line), RSI (columns), and CCI (bgcolor).
** The CCI indicator is displayed in the overbought section (CCI > +100) and oversold section (CCI < -100).
(Short-term Stop Loss can be said to be a point where profit or loss can be preserved or additional entry can be made by split trading. This is a short-term investment perspective.)
---------------------------------

AAVE CAN GO UPPERHi, dear traders. how are you ? Today we have a viewpoint to BUY/LONG the AAVE symbol.
For risk management, please don't forget stop loss and capital management
When we reach the first target, save some profit and then change the stop to entry
Comment if you have any questions
Thank You

AAVE at weekly supply zoneAAVE at the weekly supply zone, Expecting a dip if it doesn't break the resistance soon.

Aave formed huge bullish BAT | A good buy opportunityHi dear friends, hope you are well and welcome to the new trade setup of Aave token with US Dollar pair.
Previously we caught a nice trade of AAVE:
Now on a 4-hr time frame, AAVE has formed a bullish BAT pattern.
Note: Above idea is for educational purpose only. It is advised to diversify and strictly follow the stop loss, and don't get stuck with trade

The specified targets can be available to buyers!AAVE has increased in price over the past week. The ceiling of the descending channel intended for it was broken with buyer support, and the price continued to rise with a very shallow pullback to the $57 range. The resistance considered in the $63.5-66.6 has been associated with the reaction, but this range is expected to be broken and become support along with the next resistance of $69-70. In this case, the next targets of the buyers will be in the range of $80.
The range considered at $58-$63 could be a very good demand area for upside moves in the medium term if it turns into support. If we see the price rise to $80 resistance for this week, there can be enough strength and demand to continue the upward movement in the return and pullback to this support. For the short term, as long as the uptrend line drawn in the 4-hour timeframe is maintained, the specified targets can be available to buyers.
AAVEUSDT 50 % drop (NEW)AAVEUSDT 50 % drop is still possible.
-The price is currently sitting on the support.
-Weak pump expected only to get rejected from the upsloping resistance line (yellow line) which previously was acting as a support.
-Trend overall remains bearish.
Good luck

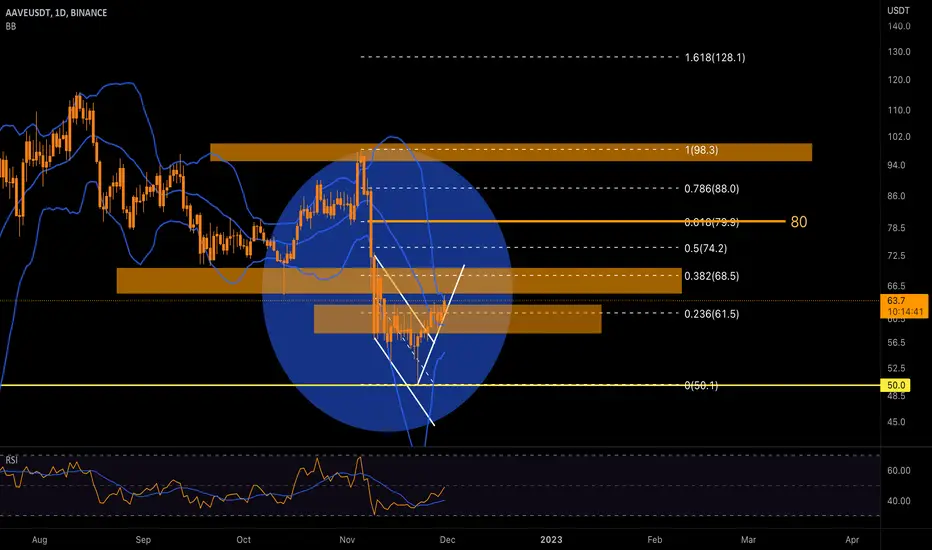
Selling pressure caused a sharp downward movement!AAVE took a sharp downward trend during the past weeks. This selling pressure caused a sharp downward movement from the resistance range of $95-100 to the monthly support in the range of $50, which is one of the sharpest drops in the trading history of this currency. Price-hitting monthly support has reacted positively, and a reversal candle has formed on the chart this week. Also, a hammer reversal pattern can be seen in the daily candlestick of the previous day.
But it should be noted that the price trend in the 4-hour timeframe is still bearish, and we can consider a channel for the price. In case of breaking the ceiling of the channel and pullback to it, we can expect price growth and a possible change in the trend. Also, the presence of several resistances in the path of upward movement can prevent price growth. Therefore, we can expect a range trend in this currency this week and next week. This range trend can be formed between the support range of $50 and the resistance of $65-70.
