AAVE consolidation before next moveAAVE has been relatively subdued so far in 2023, achieving only (!) a ~84% increase since Jan.1, when it showed a strong impulse off of the double bottom at the end of 2022. It has played out that impulse and now sits below the strong band of resistance between $90-$100, though it has turned the daily 200 MA to support. If AAVE can break above 94.36 high from Feb. 3, then I'd expect a higher low at the resistance band, followed by continuation with a new impulse up to at least 113, and maybe higher after that.
Trend (21 EMA > 55 EMA) and momentum indicators are bullish on nearly all timeframes, but the market in general is looking toppy, with BTCUSD approaching 0.618 off of the early 2023 lows. Probably due for a retracement after this latest push. If it fails to break 94.36, I expect a precipitous drop to support at the 0.382 (~$67.2), which is also the neckline of the double bottom. Risk management and tigth stop loss for long positions on this one, if not waiting for retracement. Good luck
Aaveusd

My view on the AAVEUSD - UpdateAAVEUSD | AAVEUSDT
✅ ✅ Risk warning, disclaimer: the above is a personal market judgment and analysis based on published information and historical chart data on The trading view,
And only some of these analyzes are my actual real trades.
I hope Traders consider I am Not responsible for your trades and investment decision.

AAVEUSDT Short Setup!AAVEUSDT Technical analysis update
Short level: Above $84.00
Stop loss : $90.00
Take Profit 1 : $79.00
Take Profit 2 : $73.00
Take Profit 3 : $67.00
Always keep stop loss
Thanks

AAVEUSD D1: 60% gains THE best Level to BUY/HOLD (SL/TP)(SWING)Why get subbed to me on Tradingview?
-TOP author on TradingView
-2500+ ideas published
-15+ years experience in markets
-Professional chart break downs
-Supply/Demand Zones
-TD9 counts / combo review
-Key S/R levels
-No junk on my charts
-Frequent updates
-Covering FX/crypto/US stocks
-before/after analysis
-24/7 uptime so constant updates
🎁Please hit the like button and
🎁Leave a comment to support our team!
AAVEUSD D1: 60% gains THE best Level to BUY/HOLD (SL/TP)(SWING)
IMPORTANT NOTE: speculative setup. do your own
due dill. use STOP LOSS. don't overleverage.
🔸 Summary and potential trade setup
::: AAVEUSD 1day/candle chart review
::: chart still looks good /strong
::: setup still valid as of right now
::: strong V-shape recovery
::: expecting one final pullback though
::: get ready to BUY LOW later
::: we just hit overhead resistance
::: best reload bulls near 74 USD later
::: expecting 60%+ bull run
::: re-test of sliding S/R line
::: near 120 USD also 1.62 extension
::: BULLS accumulate / WAIT FOR PULLBACK / BUY DIPS
::: expecting short-term pullback
::: BULLS get ready to BUY after pullback
::: TP bulls is +60% gains later
::: 120 USD is revised/conservative TP BULLS
::: expecting decent gains soon
::: 10-15% pullback short-term
::: recommended strategy: BUY/HOLD after pullback
::: TP BULLS +60% gains / 120 USD
::: BEST reload BULLS near 74 USD
::: TP BULLS is 120 USD final exit
::: SWING TRADE: BUY/HOLD IT
::: bull run not over yet
::: good luck traders!
::: BUY/HOLD and get paid. period.
🔸 Supply/Demand Zones
::: N/A
::: N/A
🔸 Other noteworthy technicals/fundies
::: TD9 /Combo update: N/A
::: Sentiment mid-term: BULLS 120 USD
::: Sentiment short-term: BEARS/PULLBACK/74 USD
RISK DISCLAIMER:
Trading Crypto, Futures , Forex, CFDs and Stocks involves a risk of loss.
Please consider carefully if such trading is appropriate for you.
Past performance is not indicative of future results.
Always limit your leverage and use tight stop loss.

AAVE Cup & Handle!KUCOIN:AAVEUSDT
AAVE perfect cup and handle. Breakout will provide significant upside. 2 potential targets marked 26 to 36%.
On rejection at breakout, look to enter possible pullback.
Advanced traders could play the range on LTF.
If you liked this idea or if you have your own opinion about it, write in the comments.
The information and publications are not meant to be, and do not constitute, financial, investment, trading, or other types of advice or recommendations.

AAVE - Buying SignalBYBIT:AAVEUSDT.P
1H time frame
-
Price broke out 90 again, which is the long-term changed zone of R/S.
We can regard it as a bullish signal here and plan strategy with good RRR.
-
Entry: 90
TP: 93.5, 97, 101
SL: 87

✅TS ❕ AAVEUSD: break up the downward channel✅✅ AAVE has broken the upward descending channel.
The price is held in the resistance area.
I think that AAVE can continue to grow if it gains a foothold above the resistance area. ✅
🚀 BUY scenario: long to 101,6. 🚀
----------------------------------------------------------------------------
Remember, there is no place for luck in trading - only strategy!
Thanks for the likes and comments

AAVE TA Runner upCrypto Altcoins
#CryptoWhale100Billion Alt Coin Analysis: AAVE
My Analysis shows that AAVE will increase to $65-$67 and return to resistance in the next few weeks. AAVE showing slow sales after the meltdown. Buyers are holding the $51-$54. Possible another down before running to $51 and back up to $65.
RSI showing a good bullish move. Small sales showing on the MACD. I'm more bullish for AAVE. W Pattern Forming.
Shoot me a message with your Technical Analysis to see your thoughts and trading strategies.
#CryptoWhale100Billion
Press The Thumbs Up and shoot me a message below what your idea on AAVE will hit.
Thank You for the support!
Below are some Previous chart links I've written in the past for Reference.

AAVE registered a bullish candlestickLast week, AAVE registered a bullish candlestick with a not-so-large body. The resistance that the price hit and reacted to is the $91.3 range. Also, this area has exactly overlapped with the ceiling of the medium-term descending channel, which could cause the price to have a correction towards lower supports this week. A trend change is observed in the daily time frame. Therefore, a pullback supported by 71.2 to 75.9 dollars can bring a positive reaction.
But more important support is considered in the $66.5. If weakness is observed in the uptrend, given the potential for a double ceiling pattern to form in the 4-hour timeframe, if the first support is broken, the support range of The second can bring a stronger reaction. Therefore, you can consider these two supports this week, because if there is a positive reaction to these levels, another upward movement can be formed.

Decision making time for AAVETesting some crucial resistance lets see how this plays out. Long term bullish on AAVE short term cautious.

AAVEUSD Broke above its August Resistance!The AAVE token (AAVEUSD) closed yesterday above the Lower Highs trend-line that has been in effect since the August 13 High. The 1W RSI closed last week above its own August Resistance that has had the same rejections as the price's Lower Highs.
The stochastics are overbought so some consolidation is in order now especially with the 1W MA50 (red trend-line) coming as a Resistance right above. But as long as the 1D MA50 supports, we are buying the break-out of this gem, targeting the 115.750 High.
-------------------------------------------------------------------------------
** Please LIKE 👍, FOLLOW ✅, SHARE 🙌 and COMMENT ✍ if you enjoy this idea! Also share your ideas and charts in the comments section below! **
-------------------------------------------------------------------------------
💸💸💸💸💸💸
👇 👇 👇 👇 👇 👇

Can break out of the downtrend in the short term...Hello?
Traders, welcome.
If you "Follow", you can always get new information quickly.
Please also click "Boost".
Have a nice day.
-------------------------------------
(AAVEBTC 1W Chart)
It must rise above 0.003598-0.005609 to release the rising power.
-----------------------------------------
(AAVEUSDT 1W chart)
If the price holds above 78.3, it is expected to turn into a mid- to long-term uptrend.
However, shaking it up and down is expected to cause the HA-High to fall.
(1D chart)
To continue the short-term uptrend, the price needs to rise above 86.4 to hold the price.
However, since the -100 indicator is formed at the 96.2 point, it is expected that the full-fledged rise will begin only when it rises above 96.2.
The most important thing is not to fall below 64.3, below the downtrend line.
-------------------------------------------------- -------------------------------------------
** All descriptions are for reference only and do not guarantee profit or loss in investment.
** If you share this chart, you can use the indicators normally.
** The MRHAB-T indicator includes indicators that indicate points of support and resistance.
** Check the formulas for the MS-Signal, HA-Low, and HA-High indicators at ().
** HA SRRC indicators are displayed as StochRSI (line), RSI (columns), and CCI (bgcolor).
** The CCI indicator is displayed in the overbought section (CCI > +100) and oversold section (CCI < -100).
(Short-term Stop Loss can be said to be a point where profit or loss can be preserved or additional entry can be made by split trading. This is a short-term investment perspective.)
---------------------------------

AAVE CAN GO UPPERHi, dear traders. how are you ? Today we have a viewpoint to BUY/LONG the AAVE symbol.
For risk management, please don't forget stop loss and capital management
When we reach the first target, save some profit and then change the stop to entry
Comment if you have any questions
Thank You

AAVE at weekly supply zoneAAVE at the weekly supply zone, Expecting a dip if it doesn't break the resistance soon.

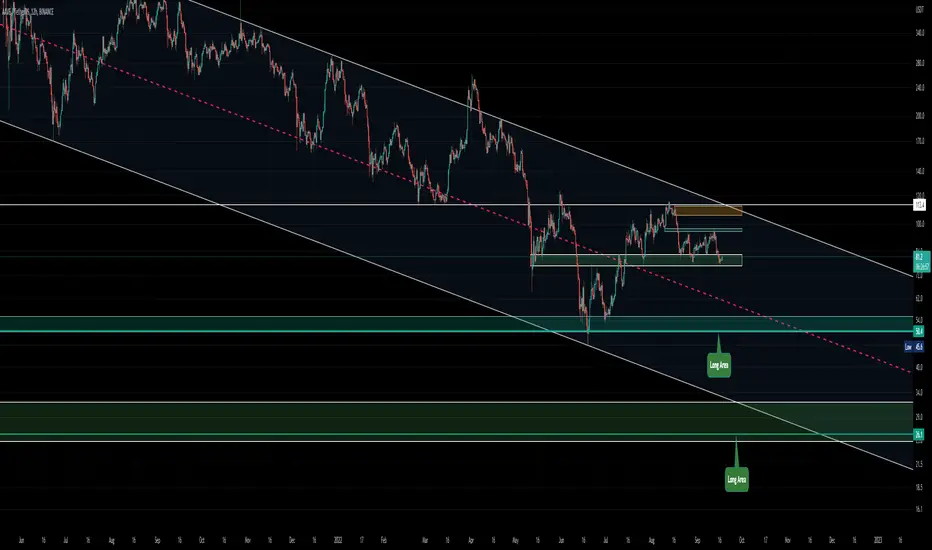
AAVE Full Movement Schematic as you can see aave is in down the Trend channel for much time, I have mentioned the Support Area in the chart and you can buy in this area and I am sure in most of them save will give you a good profit...
this is just my analysis and it's not buying or selling advice...
AAVE most likely to go downAAVE, previously LEND, is one of the lending companies that are not down yet.
Most likely it will feel the contagion of FTX on others.
I have a short position in it since this post:
AAVE/USDT short
Entry Range: $57 - 59
Price Target 1: $50
Price Target 2: $37
Price Target 3: $20
Stop Loss: $69

✅TS ❕ AAVEUSD: rebound from support✅✅ AAVE successfully reversed after reaching support
I expect continuation of growth.✅
🚀 BUY scenario: long to the resistance level.🚀
----------------------------------------------------------------------------
Remember, there is no place for luck in trading - only strategy!
Thanks for the likes and comments.

Aave formed huge bullish BAT | A good buy opportunityHi dear friends, hope you are well and welcome to the new trade setup of Aave token with US Dollar pair.
Previously we caught a nice trade of AAVE:
Now on a 4-hr time frame, AAVE has formed a bullish BAT pattern.
Note: Above idea is for educational purpose only. It is advised to diversify and strictly follow the stop loss, and don't get stuck with trade

Do not buy AAVE above this range!AAVE is not my favorite.
My suggestion: If you insist to buy it, wait until the price reaches the range shown in the chart.

AAVEVery simple ... Very clear!
Everything is marked on the chart.
This is my personal opinion. Please do not trade based on my analysis and data.

AAVE technical analysisPrice previously tapped into the 4h demand zone and bounced from there as predicted. I expect to see price moving up to fill the imbalance at $59 and tap into the 4h supply at $60.5 before potentially moving down again.

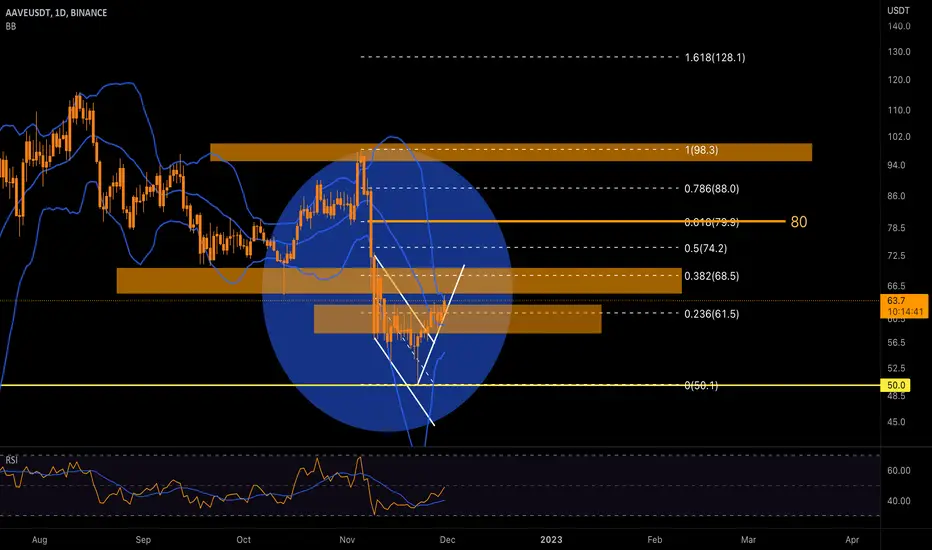
The specified targets can be available to buyers!AAVE has increased in price over the past week. The ceiling of the descending channel intended for it was broken with buyer support, and the price continued to rise with a very shallow pullback to the $57 range. The resistance considered in the $63.5-66.6 has been associated with the reaction, but this range is expected to be broken and become support along with the next resistance of $69-70. In this case, the next targets of the buyers will be in the range of $80.
The range considered at $58-$63 could be a very good demand area for upside moves in the medium term if it turns into support. If we see the price rise to $80 resistance for this week, there can be enough strength and demand to continue the upward movement in the return and pullback to this support. For the short term, as long as the uptrend line drawn in the 4-hour timeframe is maintained, the specified targets can be available to buyers.