Aaveusdt


AAVEUSDT #aave #aaveusdt @aave Didn't check the fundamentals but I think that being warmed by the influencers or Market Makers nowadays so a good price action up could be estimated in for a relatively short term :)


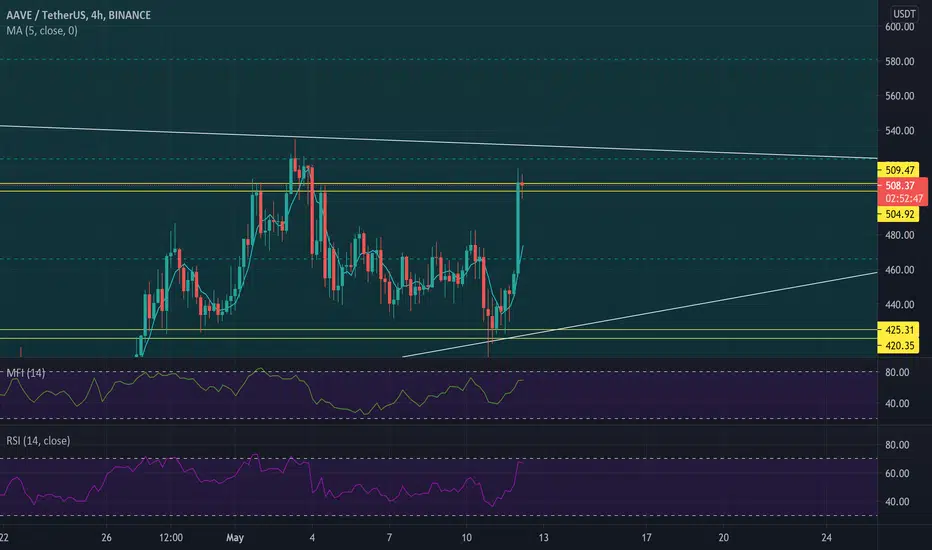
AAVEUSDT on Binance predictionAAVE USDT
Next leg up
Multiple retest at support key level range 483.61 to 468.15
Bounce off MA 20
Break at previous resistance key level range 542.32 to 567.36
My Trade:
Bought at 514.29
Target profit 1: 618.78
Target profit 2: 640.00
Stop Loss: 468.65

#AAVE#AAVE seems to be really strong at this point and ready to break this resistance.
Targets on chart.
* Not financial advice, DYOD

AAVE-USDT AAVE has been broken mid term down trending line (white line) and also static 1D-time-frame resistance (yellow line) and is trying to break short-term-resistant-line (blue line). In 4h time frame we have reverse H&S which right shoulder has been broken...
targets: 700-800


AAVEUSDTHello to you all. Mars Signals team wishes you high profits at all times.
We specified the shopping area, we can make a purchase in that area for the above purposes.
Warning: This is just a suggestion to you and we do not guarantee profits.
Wish you luck!

$AAVE/USDT 4h (Binance Futures) Bull-flag breakout and retestAave has pulled back retesting the broken descending channel acting as bullish flag!
Current Price= 497.44
Buy Entry = 476.20 - 462.55
Take Profit= 519.47 | 563.80 | 647.69
Stop Loss= 429.55
Risk/Reward= 1:1.25 | 1:2.36 | 1:4.46
Expected Profit= +21.28% | +40.16% | +75.90%
Possible Loss= -17.02%
Fib. Retracement= 0.5 | 0.786 | 1.272
Margin Leverage= 2x
Estimated Gain-time= 2 weeks

aave/busd h4Any profit or loss is the responsibility of the trader.
In my opinion, it is more likely to move down.
Like and follow for support.
Make me happy with your comments.

AFTER BREAKINGAs I posted before, now the breakout already touch TP area. RSI trend has already broken, so i think it will reach 800-1000$ its peak.
Dont forget to do risk management.
Not Financial Advise.


Aave (AAVE) • Breaking the consolidation rangeThere is good chance AAVE will finally break the range here. Pullback would offer great entry but might also not see it because we got one into the mean of the range already.
DEFI Index is also moving up.


AAVE 1H BUYAlso set some Buy orders near the Trendline
Remember no more than 5% of the deposit in one trade
SL: next sell signal


More sideways action from AAVE vs. USDTThis chart shows that we can expect to see more sideways action from AAVE but at a higher area as shown by the new support level being built.
*This is not an investment or trading advice.

Long AAVE at $457 falling wedge with MATIC breaking $1MATIC has broken out, it is time to long AAVE based on correction analysis.


