Difference between ABC and WXY Elliott Corrective WavesElliott Wave Principle , developed by Ralph Nelson Elliott, proposes that the seemingly chaotic behaviour of the different financial markets isn’t actually chaotic. In fact the markets moves in predictable, repetitive cycles or waves and can be measured and forecast using Fibonacci numbers. Elliott wave predicts that the prices of the traded financial instrument will evolve in waves: five impulsive waves and three corrective waves.
This educational article aims to present only the difference between ABC and WXY corrective waves and will not cover other wave paterns (triangle corrective waves , or any of the impulsive (motive) wave structures)
Both ABC and WXY corrective waves are patterns made of 3 waves (swings) corrective structure and this similarity mostly confuses practitioners while labeling. The main difference between the two is in the internal subdivision of the waves (legs)
Each pattern has its own rules, where ABC could be
- a ZigZag patern that have 5-3-5 internal stracture
- a Flat (Regular, Running or Expanded Flat) patern that have 3-3-5 internal stracture
while WXY patern is made of 3-3-3 internal stracture. WXY is combination of two corrective patterns , hence often called as a double three or a double correction. Each wave W, X or Y could have almost any corrective structures (double three, triple three, zigzag, flat, triangle (wave W can’t be a triangle structure), or any complex combinations)
WXY is also know as 7 swing stracture even it is made of 3-3-3 internal swings, the X-wave is considered as a connector wave because it binds two corrective waves and is counted as 1, W and Y waves are counted as 3 and hence 7 swings
WXYXZ is combination of three corrective patterns, hence often called as a triple three, a triple correction or 11 swing, WXY rules applies also for WXYXZ
Tips :
An elliott wave practitioner in general may assume a trend continuation once an ABC correction is completed. In todays market complex corrections are more common than simple corrections, the markets are in a correction phase nearly %70-%80 of the time. Hence, once an ABC correction is completed a trend continuation failure must be considered in the trading plan and in fact, this failure is the main characteristic of the X-wave, a trend that has failed. Once X wave is completed another corrective structures is to be expected
live examples (not financial advice, just experimental analysis)
GOLD
BTC
Below is a link to Elliott Wave Oscillator study, where the "EWO with Signals" indicator helps traders to track the waves (in lower degrees). It provides insight to traders to observe when an existing wave ends and when a new one begins
ABC


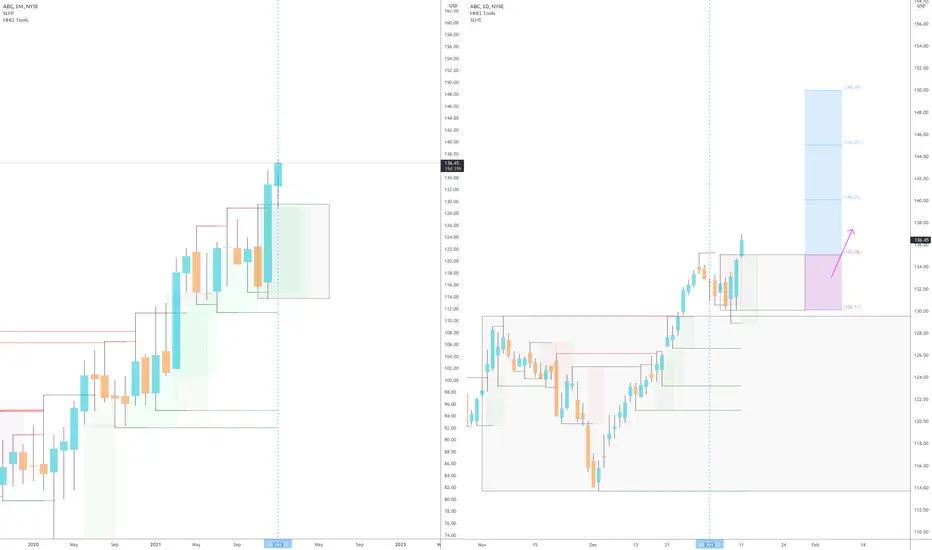
Stock : ABC / BuyNYSE:ABC made an OB+ on monthly, then made a Breaker+ on daily. It'll be fun to see how this proceeds tomorrow.
BTC retrace to 40k!Sice 41.2k low "A" we retraced to the 0.382 - 0.5 level, making a corrective wave B (a common retrace for wave B) and an sfp of the 07 dec high smaller "a" with some trapped traders at the top, that made an abc for bigger wave B, if this count is correct we should have 5 down for C that would finish the corrective wave 2, a possible retrace would be the 0.382 to 0.5 of A for wave C (short but possible) taping the last untouched daily at 40711.0.
And we are at the 2 of the fib time from wave A, that could indicate that B is finished.
All this fits my bullish bias that this is only a corrective wave 2 and we should see a new all time high after that.
B can go higher and this count could still be valid but if we go lower than 39500 this count is invalidated.

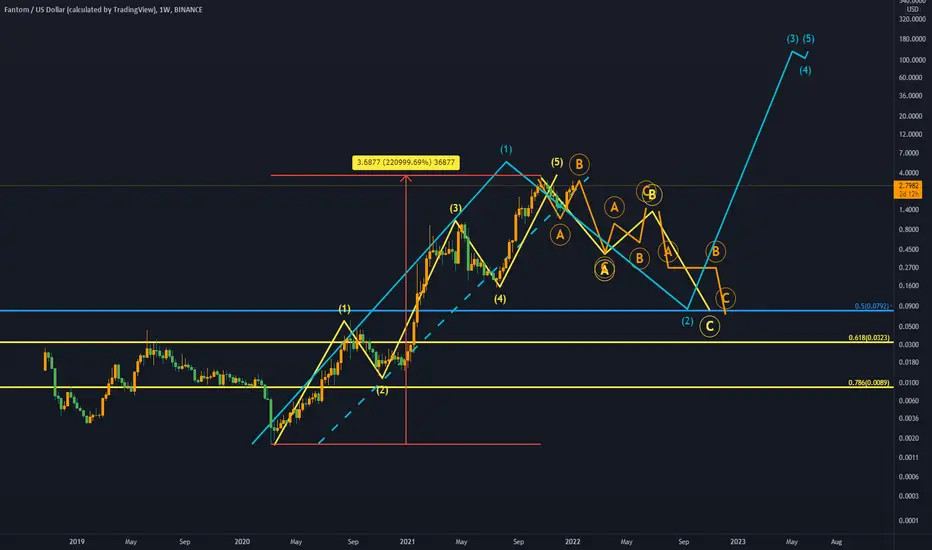
Elliot wavesIn this example.
We could to see the waves 12345 and correction ABC et the big waves in blue. :)
It is necessary to correct all this increase of 221k%
XAUDUSD BULLISH ABCXAUUSD has formed in a hourly chart an abc pattern
price is trading above the entry level 1802 with stop 1798 with targets projection to 1824.921/1831.299

AMG ABC/DEABC/ABC
ABC/DE
A 7.8M
B 6.7M
C (A) 11M
D (B) 3.1M
E (C) 8.2M
31thDec 1.8M... Target Hit the 191!
Elliott Wave Theory, or ABC wave theory, is a term for three-wave counter trend price movement. Here, wave A is the first price wave that is against the trend of the entire market. B wave is a corrective wave for wave A. Wave C shows the final price move to complete the counter trend price move.

NOA ABCA 2.4M
B 1.7M
C 1.3M
31thDec 414k...
Elliott Wave Theory, or ABC wave theory, is a term for three-wave counter trend price movement. Here, wave A is the first price wave that is against the trend of the entire market. B wave is a corrective wave for wave A. Wave C shows the final price move to complete the counter trend price move.

Amkor ABCA 50M
B 102M
C 78M
31thDec 6.1M...
Elliott Wave Theory, or ABC wave theory, is a term for three-wave counter trend price movement. Here, wave A is the first price wave that is against the trend of the entire market. B wave is a corrective wave for wave A. Wave C shows the final price move to complete the counter trend price move.


Eth Elliot Wave Prediction for $5900/$6kElliot wave prediction on the journey to $6k if we don't lose $3900 on the weekly level.

BTC My Humble Future Price Prediction In this idea i want to present how i personally see the price of BTC to behave especially after the abc retracement and alt season. Price will of course behave much differently than of what is shown on the chart, also from the time perspective. The main purpose of this is to show that this bear market can last much longer and get MUCH deeper.
Usually btc is expected to eventually correct down into the 13-15k, which would be the normal 85% correction from its ATH, but..... i know you gonna hate what i am about to say ...
Right now it is absurd to think btc can see 2.5k at one point in time, but let me tell you this... btc has never experienced REAL stock bear market. Usually during the btc bear markets, the stock market went sideways more or less, then up again as btc went on the bull run. Dow is expected to collapse below 2008 financial crisis (explained in previous ideas abot DJI) like it did in 1929 where it went below 1921 bottom (now days 2008). Till then it is yet to be seen what will happen to crypto if all this is to play out in the future. I would personally see this as the best investment opportunity of our lifetime.
Stay safe.
I am not a financial advisor so non of this should be taken as a financial advise.
BITSTAMP:BTCUSD

BTC My Personal View Of The Price Action For Next Few MonthsI expect BTC to eventually fall through this orange rectangle price area, like it did right after setting the ATH at 69k. Retail investors still have a lot of hope that BTC price will somehow recover from here and that is not usually the sign that we've bottomed yet. After capitulation i expect the price to first reach 0.618 fib. retr. lvl., then have a bit of correction, only to recover to right about 0.702 fib. retr.
Obviously price will almost certainly behave differently than what i have shown on the charts. It is just how i visualise it at the moment.
Below in the update a will show how such ABC retracement happened after BTC reached its ath 2013/14 and 2017/2018.
I am not a financial advisor so non of this should be taken as a financial advise. Be well.
BINANCE:BTCUSDT

2311 NZDJPY setup a trade down to 78.55, RR>3Hello traders,
NZDJPY is on my selling list since last idea.
But it did now go so well by just testing the pressure line. Instead, it run sidways price action and now seems good chance to sell it with a setup RR>3, DOWN TO FIBO 1.618.
RISK LOWER THAN YOUR TOLERANCE:
Suggested Risk <5%
Your Real Entry Position Will Make Different RR for Your Trade.
GOOD LUCK!!!
LESS IS MORE!

SILVER (XAGUSD) - C downIn this count we are inside a C down.
Potential targets are:
> 1st: 20.445
> 2nd: 18.2
> 3rd: 15.3

ZEC Trade ThesisZECUSDT
(RSI) under 30 / Elliot wave with ABC correction. Bottomed out @ our support lines.
Entry: $228
EXIT: $269
SL: $212

Small Love Portions is exhibiting a bottoming structureAfter a massive 3-3-5 flat correction, Small Love Portions is ready to begin its rally.
Wave C = Wave A at 100% fib level with typical momentum divergence for wave C indicating the bottom is near.
Thoughts?

21/11/24 - Gold targeting at least 50% correction Hi trader,
please see my current idea on Gold. I think we are done with our bearish impulse, due to our 5 wave structure and this big divergence on the RSI.
A 50-61.8% Fib retrace is the conclusion and our profit areas.
DXY should be weaker now. This is because of FED's released its minutes. What I have read in the paper is, that the FED is generally going to increase rates sooner depending on the inflationary environment. This news is nothing new for investors, since the increasing of rates is the only possible way to hold inflation under control. However, I think this news is already priced in the Dollar Index.
Have a great evening,
RT

ach thoughtsI hate to say this considering I'm in ACH but it looks like ACH could continue its move down all the way down to the 786 at .062 before an eventual continuation upwards. That said I'm obviously hoping the bottom is currently in :) Would love to hear thoughts from you guys.

NKN 12345 ABC retracementBased on the fib I think we can expect the ABC retracement to go down to the 786 at .49 for a continuation of the overall trend upwards. Love to hear thoughts on this.

