BITCOIN Bullflag and new all-time high ?!BULL FLAG and new all-time high 👀⏰
📇BTC daily-chart (BITSTAMP) and 💡everything important in the chart !
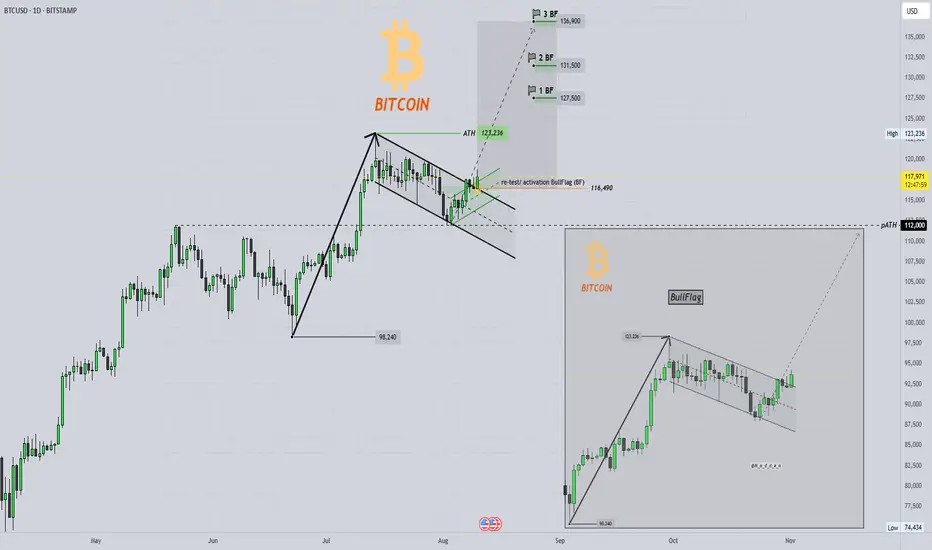
Bitcoin has broken out of its sideways consolidation and has recently successfully tested this channel (bull flag), thereby activating a potential bull flag.
The resulting targets (see example) are based on the low of approximately $98,240 and the sharp rise to the current all-time high of $123,236.
See the flags at the top with the corresponding price-targets 🏁 👀
💥Rising blue diagonal line for the previous support
💥From an indicator perspective, a possible bullish cross is imminent in the MACD-Indicator and bearish momentum may continue to decline ...
💥Finally, the bull flag (textbook) as an example of a chart pattern.
🔥Please also take a look at my last idea, as there are certain similarities based on this...
🎯 If you like this idea, please leave me a 🚀 and follow for updates 🔥⏰
Furthermore, any criticism is welcome as well as any suggestions etc. - You're also very welcome to share this idea.
I wish you a pleasant Sunday and a good start to the week & successful trading decisions 💪
M_a_d_d_e_n ✌
NOTE: The above information represents my idea and is not an investment/trading recommendation! Without any guarantee & exclusion of liability!
AB=CD
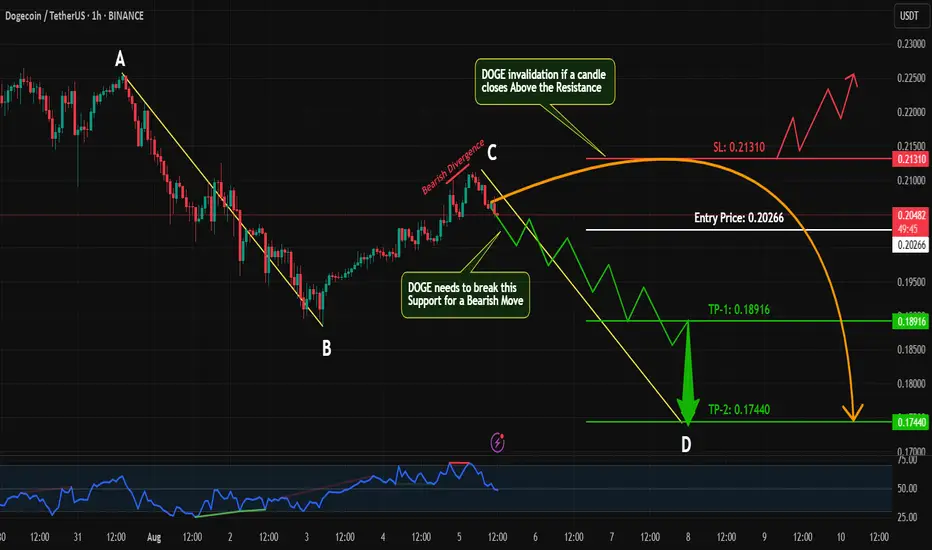
DOGE Bearish Setup in Progress |AB=CD Pattern+Bearish Divergence Hey Traders!
#DOGE/USDT is currently showing signs of a bearish continuation on the 1H timeframe 📉. Here's why I'm watching this closely:
🔹 AB=CD Harmonic Pattern:
The AB leg is already complete, and the price action is now progressing toward forming the CD leg — a classic harmonic setup suggesting further downside.
🔹 Bearish Divergence on RSI:
While the price made a higher high, RSI failed to confirm — signaling weakening momentum and potential reversal ahead.
🔹 Key Support Level in Focus:
I’m watching the previous minor support zone for confirmation. If price breaks and retests this level, it could be a great entry point for a short trade with solid risk-reward.
📌 Trade Plan:
✅ Wait for confirmation below support
✅ Look for bearish candlestick patterns or breakdown
✅ Enter short with proper risk management (SL just above local highs)
💬 What do you think about this setup? Are you already short on #DOGE or waiting for more confirmation? Drop your thoughts below 👇 and let’s discuss!
If you find this analysis helpful, don’t forget to:
👍 Like
💬 Comment
🔁 Share
📥 Follow for more high-probability setups!
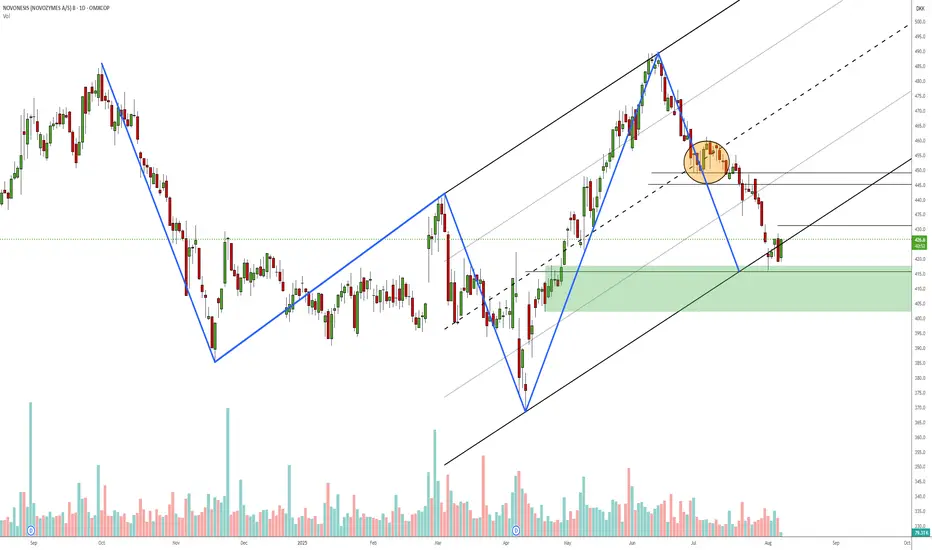
Novonesis daily reversal?Measured move / 3-point channel to test of failed symmetry zone. Might take 1/3 off around 445 depending on PA. I might add to the position if the bearish ab=cd at 431 fails and I'll be looking to take the loss if it drops below 400. Haven't used harmonic patterns for a long time, but this does resemble a 5-0 pattern if I'm not mistaken?
Natural Gas SpotFormed Gartley though break 0.786 ratio but allowed upto starting point , also forming ABCD pattern, appear ib wave B or X later will decide b or X which wave . Let see. I am not SEBI registered analyst, this is not buy , sell , hold recommendation. Only personal view for educational purpose. Thanz. if goes wrong no offence.

NZDUSD long trade dated 29 July 2025- Breakout of last LH will suggest that the odds are in favour of the long trade
- Presence of a bullish AB=CD pattern increases our chances. However entry set via Buy Stop after confirmed trend reversal

OGDC Breakout?On a daily timeframe, OGDC has given breakout of a triangle pattern. This will open up doors for it to move towards its all-time high i.e. ~290 region.
This is my personal opinion, not a buy / sell call.
All other indicators e.g. RSI, Stoch and MACD are bullish as well.

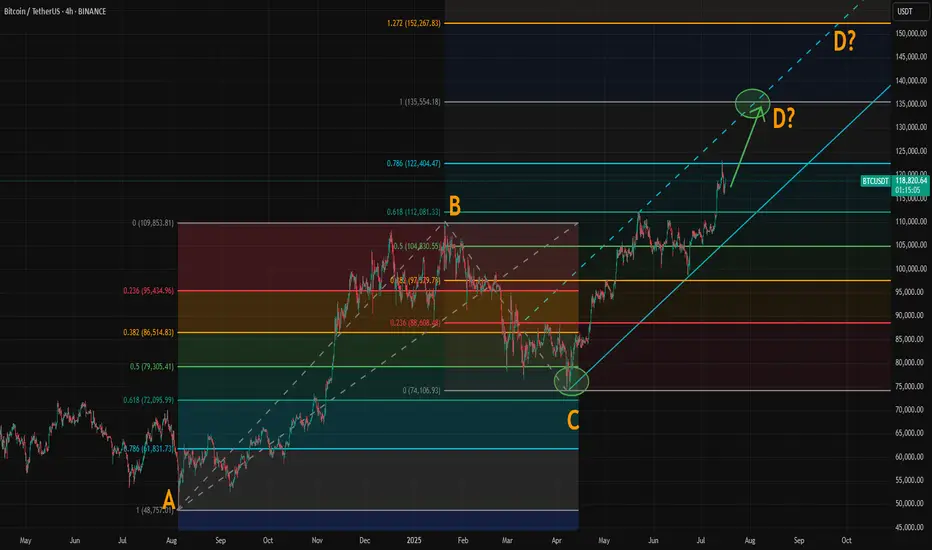
Where Could Bitcoin Make Its Cycle Top? Model and ABCD AlignedWith the breakout above resistance around 110,000, Bitcoin’s rally appears to be back on track. If you've been following our crypto analysis, either here or on our website, you’ll know our target range for this bull cycle is between 135,000 and 150,000, with the top of the range possibly extending further depending on the strength of the final wave.
Now, a possible ABCD pattern is forming, with point D potentially landing at either 135,000 or 150,000. A coincidence? Maybe, maybe not.
How Did We Arrive at the 135K–150K Target?
We based this range on historical halving cycle returns:
Halving Year - Return to Cycle Top
2012 - 9,076%
2016 - 2,122% (↓ 4.27x)
2020 - 541% (↓ 3.92x)
Two things stand out:
Each cycle has shown diminishing returns.
The rate of decline appears roughly consistent, dropping by around 4x each time—but slightly less with each cycle.
So depending on the multiplier used:
If returns fall by 4.27x again → target: 135K
If reduced by 4x → target: 140K
If reduced by 3.92x → target: 142K
If the rate of reduction itself slows (difference of 0.35 between 4.27 and 3.92) → target: 150K
While the sample size is too small, we believe the model holds reasonable logic with fundamental backing from various metrics.
The chart now shows a possible ABCD pattern:
If it becomes a classic AB = CD structure, point D could form near 135K.
If it becomes an extended ABCD (with CD = AB × 1.272), then point D could reach just above 150K.
These technical targets align closely with our halving model projections, increasing our confidence in the 135K–150K range as a likely top zone for this cycle.
Also, please check our earlier post for possible altseason start. A correlation between BTC/ETH and Gold/Silver might give some tips about possible Ether surge.
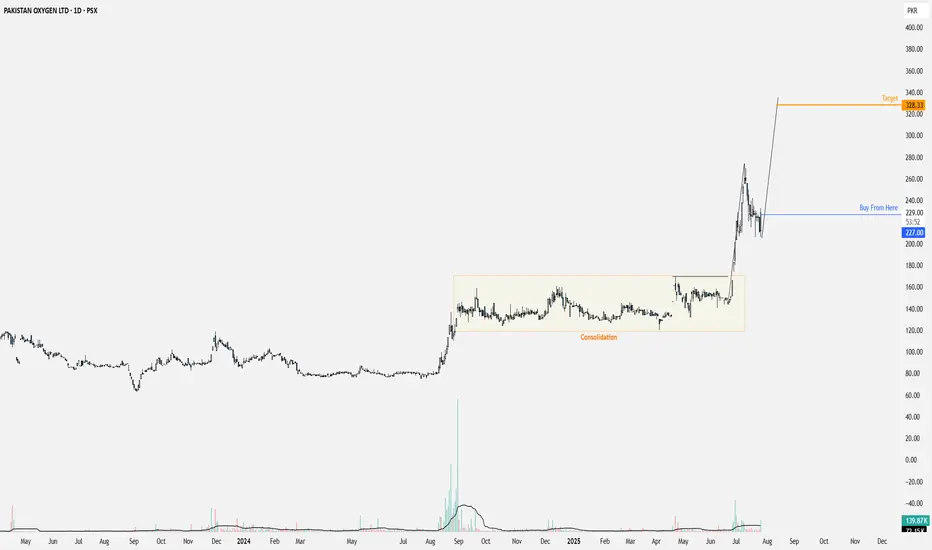
PAKOXY is forming ABCD PatternAfter the longest consolidation, PAKOXY has given a breakout and is now forming an ABCD Pattern.
Handsome ROI.
BUY USDJPYThe price drop on UJ has been wild however price is at a good support zone, we see the ABCD pattern by way of a bullish Fibonacci invasion setup hoping it will give good liquidity. Buy wisely.

Bond Bulls Smell Blood: 20-Year Yields Likely to Fall🧩 Fundamental Bear Case for 20-Year Yields
1. Recession Risk and Slowing Growth
Leading economic indicators (e.g., ISM Manufacturing, Conference Board LEI) continue to suggest softening demand across key sectors.
A recession or significant slowdown would drive capital into long-duration Treasuries, causing yields to fall as bond prices rise.
Historically, 20-year yields fall 200–300bps from cycle peaks during recessions. With yields near 5%, there is ample downside room.
2. Federal Reserve Policy Pivot
The Fed’s hiking cycle appears to be at or near its terminal point. Rate cuts in 2025 are increasingly priced in, especially as inflation moderates.
If inflation continues to decelerate toward the Fed’s 2% target while growth slows, the Fed may be forced to ease sooner or more aggressively than expected.
Long-duration bonds, including the 20Y, are highly sensitive to forward rate expectations and would benefit from a dovish pivot.
3. Disinflationary Trends
Core inflation metrics (e.g., Core PCE, Core CPI) are in year-over-year decline.
Key disinflationary forces:
Wage pressures have eased as labor markets normalize.
Housing costs, which lag in CPI data, are projected to fall further.
Supply chain normalization continues post-COVID.
These factors reduce the need for elevated long-term yields, especially with inflation expectations anchored.
4. Supply-Demand Dynamics Favor Treasuries
Despite large Treasury issuance, global demand remains strong:
Foreign buyers (e.g., Japan, EU) seek higher yields as their home rates remain low or negative.
U.S. institutions (pensions, insurance funds) are rebalancing into risk-free long bonds amid equity volatility.
A risk-off rotation or broader de-leveraging cycle would only accelerate this demand.
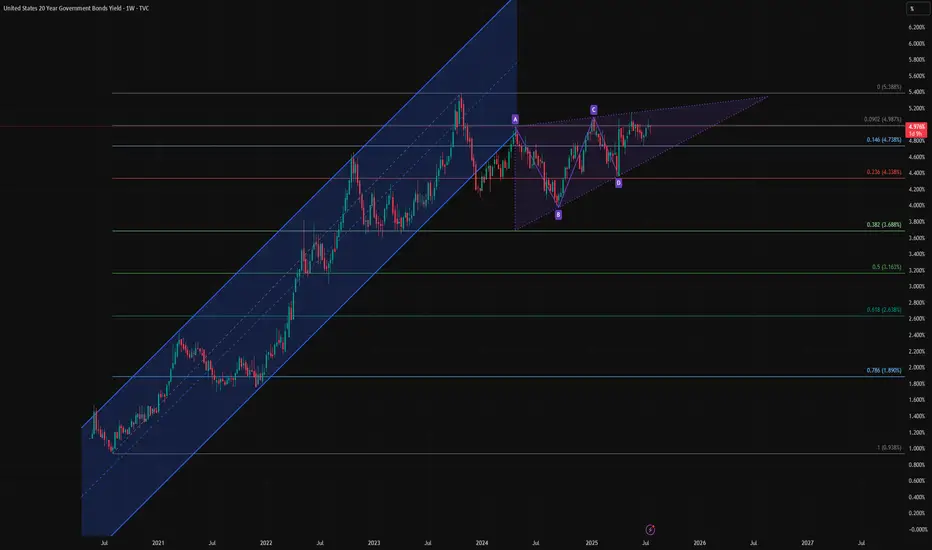
🔍 Technical Summary
Rising wedge pattern is nearing a potential breakdown — a bearish structure signaling exhaustion.
Price is failing to reclaim the previous uptrend channel, now acting as resistance.
A completed harmonic AB=CD pattern near recent highs suggests a mean-reverting move could be imminent.
Closest technical targets include:
4.33% (23.6% Fib)
3.68% (38.2% Fib)
Possibly even 3.16% (50% retracement) over the next 6–12 months if macro weakness persists.
📌 Bottom Line
The combination of:
Cooling inflation
A Fed pivot on the horizon
Rising recession risk
And technical exhaustion signals
Supports a bearish outlook for 20-year yields, meaning bond prices (especially long-duration instruments like TMF or TLT) could appreciate meaningfully from here.
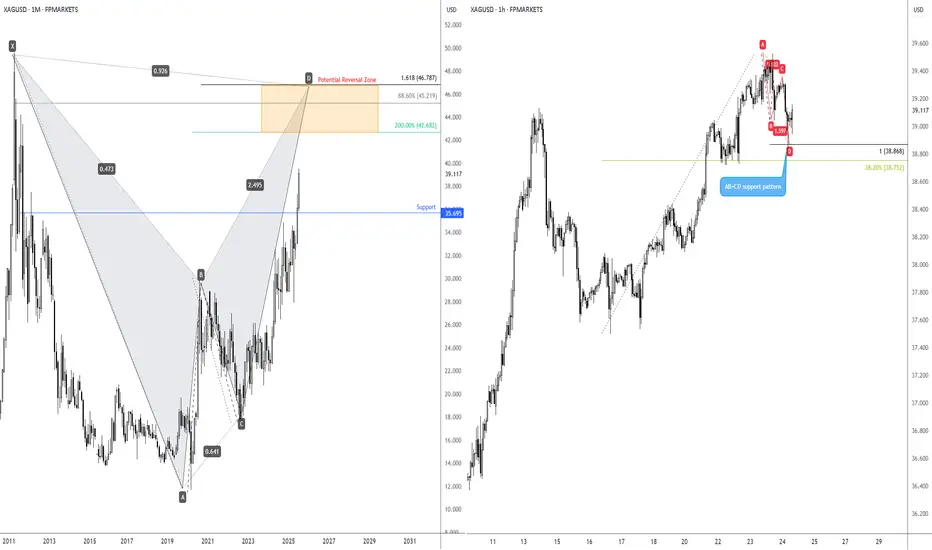
Long-term bullish action on Silver?I touched on the longer-term price action of Spot Silver (XAG/USD) last week, showing that the unit is on track to shake hands with a Potential Reversal Zone (PRZ) of a monthly harmonic bat pattern between US$46.79 and US$42.68.
Keeping things aligned with the harmonic landscape, you will note that H1 price action recently printed an AB=CD bullish pattern at US$38.87 (100% projection ratio), set just north of a 38.2% Fibonacci retracement ratio of US$38.75. While the H1 chart is generally considered short-term in nature, you may find that given we have longer-term flow suggesting scope for additional outperformance, short-term dip-buyers may consider holding a portion of their long positions open in an attempt to catch some of the possible longer-term upside.
MUBARAKUSDT: Mid-Term Analysis🕌 MUBARAKUSDT Analysis
I think you can find a buyer from the blue box I’ve marked.
📍 Plan
If price comes into the blue box:
✅ Watch for footprint absorption (buyers holding the level)
✅ Look for CDV support or bullish divergence
✅ Wait for structure reclaim to confirm entry
⚡ Reminder
No chasing, no guessing.
If the setup aligns, take the trade with clear risk.
If not, let it go.
Stay patient. The right price, or no trade.
📌I keep my charts clean and simple because I believe clarity leads to better decisions.
📌My approach is built on years of experience and a solid track record. I don’t claim to know it all but I’m confident in my ability to spot high-probability setups.
📌If you would like to learn how to use the heatmap, cumulative volume delta and volume footprint techniques that I use below to determine very accurate demand regions, you can send me a private message. I help anyone who wants it completely free of charge.
🔑I have a long list of my proven technique below:
🎯 ZENUSDT.P: Patience & Profitability | %230 Reaction from the Sniper Entry
🐶 DOGEUSDT.P: Next Move
🎨 RENDERUSDT.P: Opportunity of the Month
💎 ETHUSDT.P: Where to Retrace
🟢 BNBUSDT.P: Potential Surge
📊 BTC Dominance: Reaction Zone
🌊 WAVESUSDT.P: Demand Zone Potential
🟣 UNIUSDT.P: Long-Term Trade
🔵 XRPUSDT.P: Entry Zones
🔗 LINKUSDT.P: Follow The River
📈 BTCUSDT.P: Two Key Demand Zones
🟩 POLUSDT: Bullish Momentum
🌟 PENDLEUSDT.P: Where Opportunity Meets Precision
🔥 BTCUSDT.P: Liquidation of Highly Leveraged Longs
🌊 SOLUSDT.P: SOL's Dip - Your Opportunity
🐸 1000PEPEUSDT.P: Prime Bounce Zone Unlocked
🚀 ETHUSDT.P: Set to Explode - Don't Miss This Game Changer
🤖 IQUSDT: Smart Plan
⚡️ PONDUSDT: A Trade Not Taken Is Better Than a Losing One
💼 STMXUSDT: 2 Buying Areas
🐢 TURBOUSDT: Buy Zones and Buyer Presence
🌍 ICPUSDT.P: Massive Upside Potential | Check the Trade Update For Seeing Results
🟠 IDEXUSDT: Spot Buy Area | %26 Profit if You Trade with MSB
📌 USUALUSDT: Buyers Are Active + %70 Profit in Total
🌟 FORTHUSDT: Sniper Entry +%26 Reaction
🐳 QKCUSDT: Sniper Entry +%57 Reaction
📊 BTC.D: Retest of Key Area Highly Likely
📊 XNOUSDT %80 Reaction with a Simple Blue Box!
📊 BELUSDT Amazing %120 Reaction!
📊 Simple Red Box, Extraordinary Results
📊 TIAUSDT | Still No Buyers—Maintaining a Bearish Outlook
📊 OGNUSDT | One of Today’s Highest Volume Gainers – +32.44%
📊 TRXUSDT - I Do My Thing Again
📊 FLOKIUSDT - +%100 From Blue Box!
📊 SFP/USDT - Perfect Entry %80 Profit!
📊 AAVEUSDT - WE DID IT AGAIN!
I stopped adding to the list because it's kinda tiring to add 5-10 charts in every move but you can check my profile and see that it goes on..

BTC: What if the real bull run is just beginning?🚀 BTC/USD – Weekly buy signal on the way?
📈 EMA 7 / SMA 20 crossover validated on a weekly basis
✅ Long-term bullish trend
⏸️ Short-term trend neutral
In my opinion, a bullish continuation in the long-term remains possible, particularly via an AB = CD structure for patient investors.
Of course, in small time frames, volatility will be present, but the underlying trend remains positive.
📌 Pivotal zone to break:
104,432 – 109,396 USD
➡️ A break of this resistance would provide a real boost to the bullish trend.
Next? Let's close our eyes... and let the position run.
⚠️ Analysis for educational purposes – not financial advice.
💬 Do you believe this weekly signal? Or are you staying on the sidelines for now?

EURUSD Bullish Continuation OutlookFX:EURUSD has been trading in a bullish trend. Currently price is retesting the previous resistance level, as well as 0.618 fib. Hidden bullish divergence can be observed on the chart, in addition to regular bullish divergence on lower timeframes (1 & 4 hour).
I am expecting bullish continuation from here to complete the price projections!

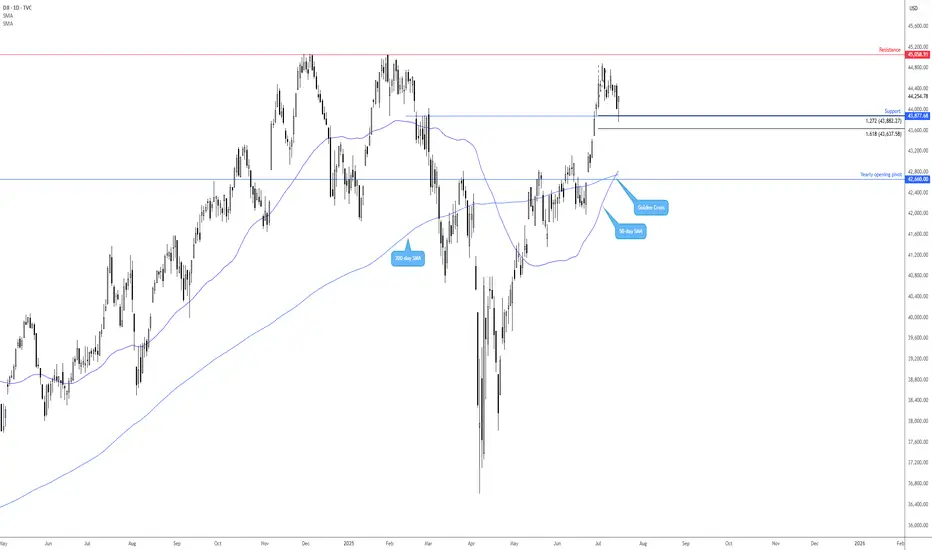
Dow offering buyers much to work with!The Dow Jones Industrial Average (DOW) is clearly trending higher, pencilling in a series of higher highs and higher lows. Supporting this trend is the 50-day simple moving average (SMA) at 42,816 crossing above the 200-day SMA at 42,749; this is referred to as a ‘Golden Cross’ and suggests a longer-term uptrend may be on the table.
This, coupled with the recent ‘alternate’ AB=CD bullish formation (1.272% Fibonacci projection ratio) completing at support from 43,877, has already seen buyers step in (with stops potentially located south of the 1.618% Fibonacci projection ratio of 43,637). The next upside objective from here rests around resistance at 45,058, closely shadowed by the all-time high of 45,073.
Written by the FP Markets Research Team
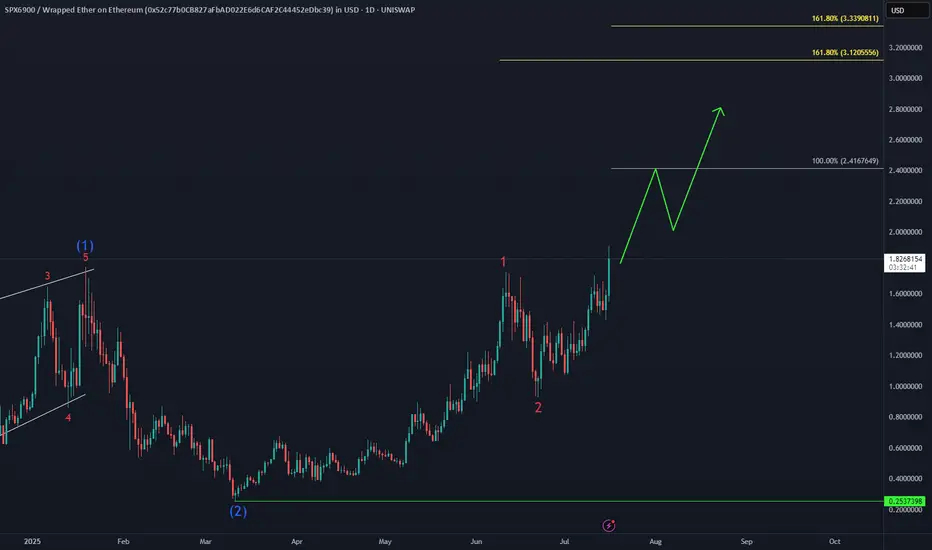
#SPX6900 Bullish SequenceThe Gate Is Open – Send It 🚀🚀🚀
UNISWAP:SPXWETH_52C77B.USD just smashed into a new all-time high, unlocking the next bullish targets at $2.4 and $3.1.
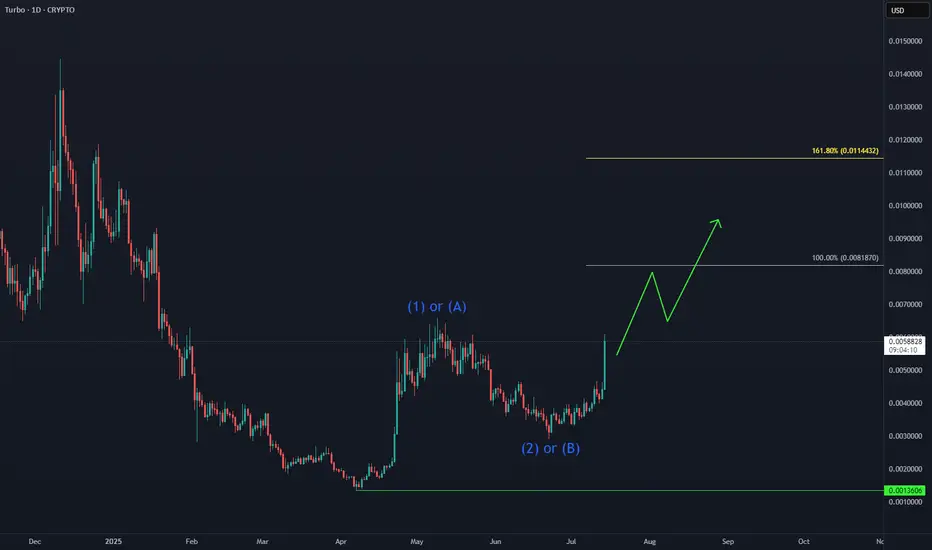
TURBO: Next Leg Higher in Progress📈 CRYPTO:TURBOUSD is building momentum after holding key support levels, with Elliott Wave projections pointing toward the equal legs target zone at $0.008–$0.011. The recent bullish structure suggests continuation, especially following its Binance US listing and strong community backing.
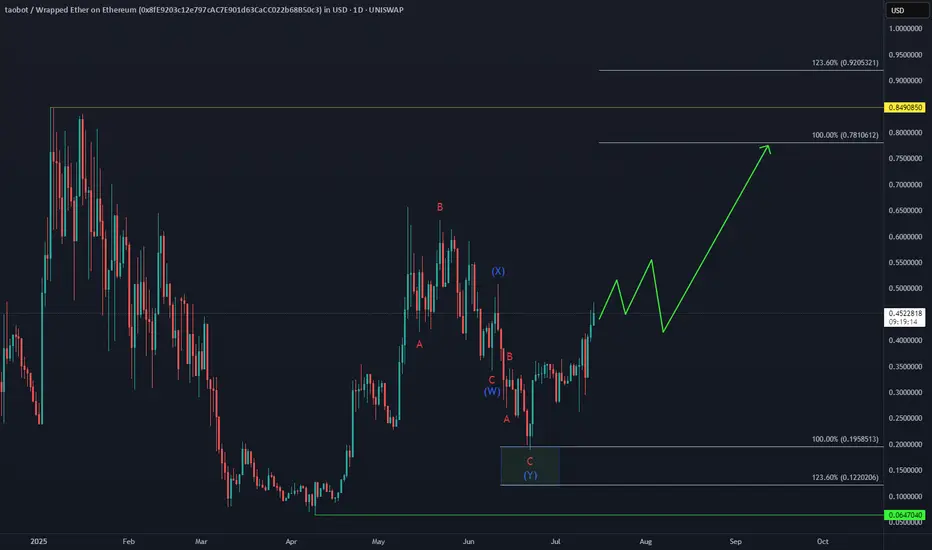
TAOBOT Eyes Further Upside Toward New ATHAfter forming a short-term higher high sequence from the June low, UNISWAP:TAOBOTWETH_8FE920.USD is building bullish momentum.
The next target sits in the equal legs area $0.78–$0.92 zone potentially paving the way for a new all-time high.
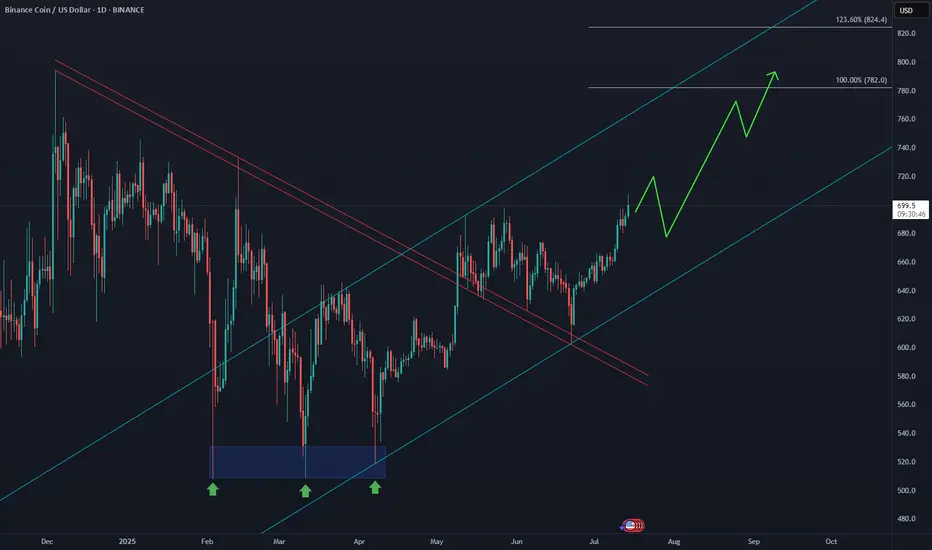
BNB Aiming for New All-Time Highs📈 After breaking above the May peak, CRYPTOCAP:BNB has activated a bullish sequence, with the equal legs target zone projected at $782–$824. This aligns with Elliott Wave extensions and confirms strong momentum from the June lows.
Bitcoin (BTCUSDT) Potential Move from $43,600 to $120,000Description:
Based on the current weekly chart analysis for Bitcoin / Tether Standard Futures (BTCUSDT), there is a significant potential for Bitcoin to move from $43,600 to $120,000. Below are the key points observed:
Current Price: Bitcoin is currently trading at approximately $54,806.45, down by 5.75%.
Elliott Wave Analysis:
The chart indicates a potential ABC correction pattern.
Wave A has completed, and Bitcoin is currently in Wave B, which suggests an upcoming bullish Wave C.
Support and Resistance Levels:
The primary support level is at $39,987.31.
The significant resistance level and target is the area around $120,000.
Fibonacci Retracement Levels:
38.2% Retracement: $31,145.00
50.0% Retracement: $23,356.00
61.8% Retracement: $15,568.00
Indicators:
RSI shows potential bullish divergence indicating a possible upward move.
Volume profile indicates strong accumulation in the lower price ranges.
Extrem Buy Alert: The chart highlights an "EXTREM BUY ALERT," suggesting that the current levels could be a significant buying opportunity before the expected upward move.
Chart Details:
Timeframe: Weekly (1W)
Ticker: BTCUSDT.PS
Exchange: Binance
Disclaimer: This analysis is based on historical data and technical indicators. It is not financial advice. Please conduct your own research before making any trading decisions.

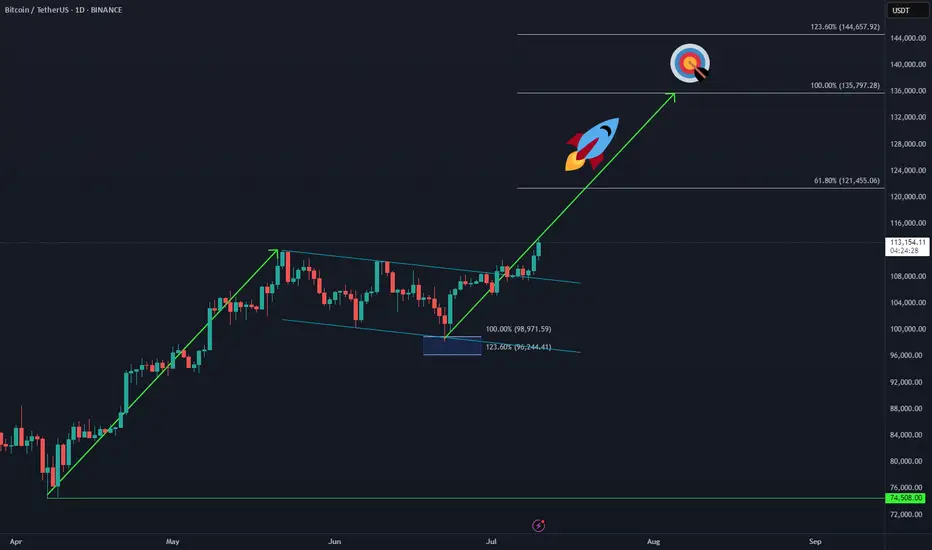
Bitcoin Makes New ATH – Next Sequence in Play 🚀 CRYPTO:BTCUSD has officially broken into new all-time highs, confirming the next bullish sequence is underway.
The upside projection now opens toward the $135K–$144K zone, aligning with long-term Fibonacci extensions and cycle projections.
📌 As always, it won’t be a straight line—expect step-by-step progress, with consolidations and pullbacks along the way. But the structure remains bullish, and the path is unfolding.
Ethereum Breakout Is Imminent!🚀 CRYPTO:ETHUSD is approaching the June peak, and a breakout would confirm a bullish sequence in play.
Upside targets are set at $3,600 – $3,960, aligning with key Fibonacci levels and challenging the 2024 highs.

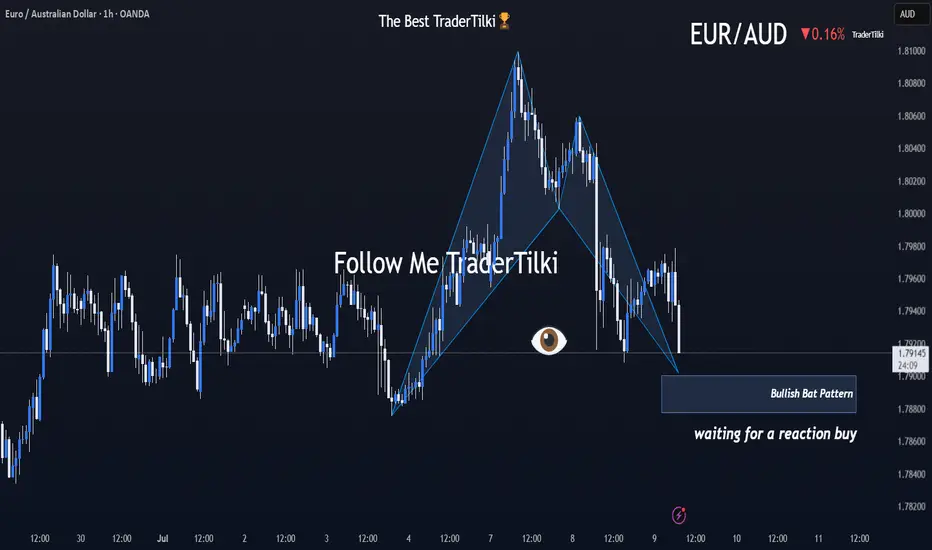
Brace Yourselves: EURAUD’s Harmonic Storm Is Coming!Good morning, Traders ☀️
I've identified a bullish harmonic Bat pattern on the EURAUD pair.
At this stage, I'm only anticipating a reactional buy from the marked zone.
I'll determine my target level after observing the market's response from that area.
📌 I’ll be sharing the target details under this post once the reaction unfolds.
Your likes and support are what keep me motivated to share these analyses consistently.
Huge thanks to everyone who shows love and appreciation! 🙏