KASPA accumulation from ETH strategy, continued..I was waiting to sell about 25 more ETH to accumulate ~1 million Kaspa if KAS/ETH hits ~0.000025 or lower; base on the orange measured move drawn and circled (at the bottom thick yellow support line).
However, it appears a bullish is starting to form on the FG{50/15} histogram, and the previous daily candle on the 7Feb2025 engulfs the previous red candle on the 6Feb2025.
If KAS/ETH is able to break above the golden pocket (dashed horizontal thick yellow line), and then subsequently breaks above the top of the narrowing wedge (defined by thin white lines), then it is likely for KAS to continue above the 50 Fib retrace level and to the top of the thick yellow long-term resistance level.
Note: Here the Fib levels were redrawn, as comparted to my earlier published analysis.
If KAS/ETH breaks below the golden pocket at the 65% retrace lvl, then opportunity to accumulate KAS from ETH at or below 0.000025 ETH per KAS will then become likely.
AB=CD

Prepare yourself for a $17K ETH !
Hello, Traders 🐺
As I promised you, my dear friends, in my previous idea about BTC.D (link to BTC.D idea is below this post) , I’m here to share some amazing updates on ETH , which I’ve been wanting to share for a long time.
Honestly, guys, I’ve been waiting for the right time to do this because I’m a dedicated trader , and I believe that trading is all about perfect timing . In my humble opinion , this is the beginning of the ETH season , and you should definitely consider buying some.
(This is not financial advice! Do your own research.)
So, let's begin:
As you can see, every single time , we have had a final shakeout before the pump , and right after that , ETH has made a massive and explosive move .
I’ve tried to make it as clear as possible for you guys by highlighting all the necessary details on the charts . However, if you still have any questions, feel free to ask them below this idea.
Also, don’t forget to follow me and like this idea to show your support! 🚀🔥

IBM Pivoting downward. IBMA nicely proportional AB=CD pattern here, with RSX divergence (momentum) present. This is significant. Crosses and confluence on VZO and Stoch RSI, BB %RCT downgoing. Fibonacci offer some static goals. A word on goals - we discourage use of anything static in the markets. The nature of markets is such that the system is far too dynamic for any rigid rules to be profitable. We thus use a dynamic system, such as an indicator based algorithm for exits.
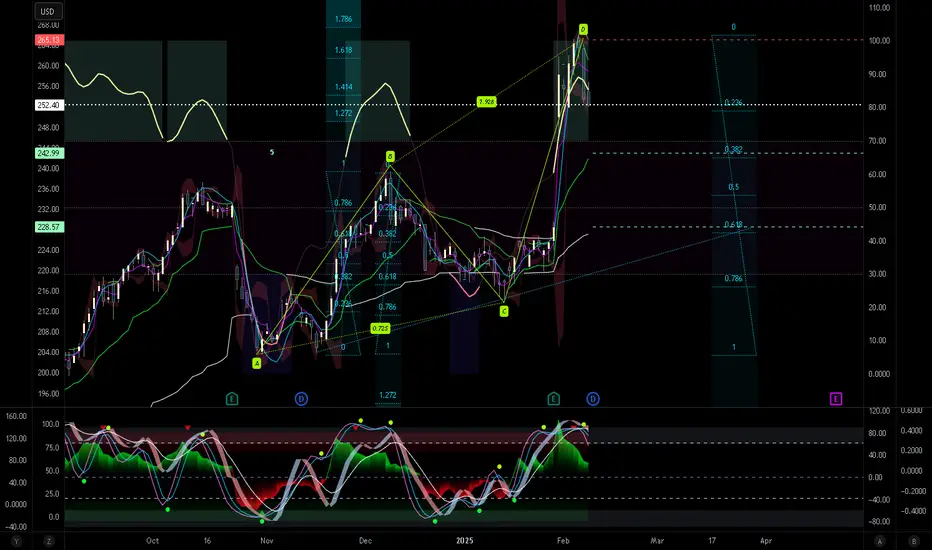
Chart Anylisis 1Hour check captain XAUUSD Chart Anylisis 1Hour idea 💡
Buy zone
2772_____2778
Trade at own your risk use proper money management

Bullish projections for GOLDA couple of confluences indicate that Gold will continue its bullish rally. First and most important is an overall trend quite bullish yet showing no signs of a proper reversal trend. Moreover, we can also see the pattern of AB=CD, and the values of this pattern are according to the standard which means that if "C" retracement happens at .5 then the projection of "BC=2" and in our case these conditions have been met. Right now price is almost touching the last HH of 2791.64 and in this scenario, we can see some healthy retracement or maybe bearish divergence which will push the price downwards and then surpass the last HH.

Bitcoin - Crash to 50k in 2026! (Best cycles analysis)In this very detailed and unique analysis, we will look at the most important Bitcoin fundamental analysis of halving cycles. I predict Bitcoin will crash to 50k in 2026, so if you are buying now for the long term as an investment (buy and hold), you can probably wait for a better price!
Statistically, Bitcoin crashes every 4 years by 86% to 77%. The market cap is getting bigger as institutions stepping in, so this time I expect a weaker crash (around 65%). Still, it's a huge crash, and many investors will sell at a loss as usual. Knowledge of the Bitcoin cycles will save you a lot of money.
We are in the final stage of the bullish cycle, and this cycle should end between February and November 2025. When you draw a trendline on the linear monthly chart, you will get a target of around 125,000 USD. This is a good level to sell Bitcoin. I would never listen to moon boys that are screaming that Bitcoin will never go down and Bitcoin will reach 500k or 1M in the next months. That's due to an already big market cap, pretty much impossible. After we finish this bull cycle, we can expect a massive crash to 50k in 2026. For people who are prepared, this may be an incredible investment opportunity. Also, you can short Bitcoin at the top and ride the investment in the opposite direction, plus you will make money on funding fees every 8 hours.
Bitcoin halving is coded to occur once every 210,000 blocks, or roughly every four years, and will continue in this fashion until the final supply of 21 million BTC is reached. It is assumed that the last BTC will be mined in 2140. After that, transaction fees are supposed to be the only source of block rewards for miners.
Write a comment with your altcoin, and I will make an analysis for you in response. Also, please hit boost and follow for more ideas. Trading is not hard if you have a good coach! This is not a trade setup, as there is no stop-loss or profit target. I share my trades privately. Thank you, and I wish you successful trades!

32% gains on Next Capital TradeThe stock has recently broke out the consolidation zone and now making new HHs and HLs.
Instant Entry can be taken with TP1 in mind of Rs. 11.02 and TP2 of 13.02
Stop Loss can be placed below the recent HL which is 7.02 to make RR 1:1 and 1: 2

BTCUSDTBTCUSDT will go for Target indicated in the graph as long as it does not test 66600 in the long term according to ABCD fibo pattern

TRBUSDT:100% Daily Volume Surge – A Bullish Setup in the Making!Extreme Bullish Potential with Smart Entry Points
"TRBUSDT is catching attention with a 100% daily volume increase. Big moves like this don’t happen by accident – the market is speaking, and we’re listening."
Here’s What I See:
Black Line Manipulation: If the price manipulates the black line, I believe the chart will enter an extreme bullish condition. However, patience is key – no trades without confirmation of an upward breakout.
Breakout and Retest: The golden rule – wait for the breakout, then target the retest for a strong and safe entry.
Demand Zones Below: Let’s not forget, there are solid demand zones below that could provide additional opportunities.
Key Observations:
"As always, I rely on the data: CDV, volume profile, and liquidity heatmap must confirm the expected price action before I commit to a trade. No confirmation, no entry!"
This is a chart full of potential. Be patient, act smart, and let the market show its hand. 🚀
Let me tell you, this is something special. These insights, these setups—they’re not just good; they’re game-changers. I've spent years refining my approach, and the results speak for themselves. People are always asking, "How do you spot these opportunities?" It’s simple: experience, clarity, and a focus on high-probability moves.
Want to know how I use heatmaps, cumulative volume delta, and volume footprint techniques to find demand zones with precision? I’m happy to share—just send me a message. No cost, no catch. I believe in helping people make smarter decisions.
Here are some of my recent analyses. Each one highlights key opportunities:
🚀 RENDERUSDT: Strategic Support Zones at the Blue Boxes +%45 Reaction
🎯 PUNDIXUSDT: Huge Opportunity | 250% Volume Spike - %60 Reaction Sniper Entry
🌐 CryptoMarkets TOTAL2: Support Zone
🚀 GMTUSDT: %35 FAST REJECTION FROM THE RED BOX
🎯 ZENUSDT.P: Patience & Profitability | %230 Reaction from the Sniper Entry
🎯 DEXEUSDT %180 Reaction with %9 Stop
🐶 DOGEUSDT.P: Next Move
🎨 RENDERUSDT.P: Opportunity of the Month
💎 ETHUSDT.P: Where to Retrace
🟢 BNBUSDT.P: Potential Surge
📊 BTC Dominance: Reaction Zone
🌊 WAVESUSDT.P: Demand Zone Potential
🟣 UNIUSDT.P: Long-Term Trade
🔵 XRPUSDT.P: Entry Zones
🔗 LINKUSDT.P: Follow The River
📈 BTCUSDT.P: Two Key Demand Zones
🟩 POLUSDT: Bullish Momentum
🌟 PENDLEUSDT.P: Where Opportunity Meets Precision
🔥 BTCUSDT.P: Liquidation of Highly Leveraged Longs
🌊 SOLUSDT.P: SOL's Dip - Your Opportunity
🐸 1000PEPEUSDT.P: Prime Bounce Zone Unlocked
🚀 ETHUSDT.P: Set to Explode - Don't Miss This Game Changer
🤖 IQUSDT: Smart Plan
⚡️ PONDUSDT: A Trade Not Taken Is Better Than a Losing One
💼 STMXUSDT: 2 Buying Areas
🐢 TURBOUSDT: Buy Zones and Buyer Presence
🌍 ICPUSDT.P: Massive Upside Potential | Check the Trade Update For Seeing Results
🟠 IDEXUSDT: Spot Buy Area | %26 Profit if You Trade with MSB
📌 USUALUSDT: Buyers Are Active + %70 Profit in Total
🌟 FORTHUSDT: Sniper Entry +%26 Reaction
🐳 QKCUSDT: Sniper Entry +%57 Reaction
📊 BTC.D: Retest of Key Area Highly Likely
This list? It’s just a small piece of what I’ve been working on. There’s so much more. Go check my profile, see the results for yourself. My goal is simple: provide value and help you win. If you’ve got questions, I’ve got answers. Let’s get to work!

Bitcoin - Very bullish, Ethereum will +50% in a week!Bitcoin is currently very bullish, as the price broke the 60-day long range. Bitcoin hit an all-time high yesterday, which confirms the breakout of the range. We can expect 122k to be hit in the near future, but let's take a look at Ethereum, because this is a very good indicator, not only for bitcoin but for altcoins in general.
Ethereum is forming a huge inverse head-and-shoulders pattern. Don't be surprised if ETH starts pumping like crazy; this is probably your last chance to buy it cheap! You can wake up in the morning and see a huge green dildo on the ETHUSDT chart, so you really don't want to miss it. Personally, I would prefer ETH over BTC in the next few days or weeks.
Back to Bitcoin. What we can see on the chart is my Elliott wave count. We are in the final wave (5) of a major impulse wave. It's time to set up your sell orders and prepare for a significant bear market in 2025/2026. I recommend selling Bitcoin around 120k, while moonboys expect 300k or 500k. I stay grounded, I don't think Bitcoin will go exponentially.
Write a comment with your altcoin, and I will make an analysis for you in response. Also, please hit boost and follow for more ideas. Trading is not hard if you have a good coach! This is not a trade setup, as there is no stop-loss or profit target. I share my trades privately. Thank you, and I wish you successful trades!

Bullish for Mickey D's. MCDUpgoing XABC harmonic (or Elliott A Wave of X Wave - not shown). MIDAS crossed, Ehlers Ultimate Smoother upgoing and supporting price action. Volatility also moving up. If we assume channeling, Kennedy's approach gives primary and secondary goals. A prudent point to address is that probabilistic approaches used in market analysis are ever changing. This idea is thus only relevant at the exact moment it is published. Further price action will most likely deviate from this current standpoint.
Looking for a rise from Eli Lilly. LLYBullish outlook, betting on an upgoing flat. Kennedy channeling gives some Fibonacci, which are confluent with straight Fib projections. The constellation for bullish bias is completed by multiple momentum divergences, break of Midas indicator line, Ehler's US supporting price action and recent crosses on stochRSI and smoothed VZO. Goals in green, rejection of idea in red.


GBP/USD $$$
GU at the all TF is bullish. all the zones is valid just take LTF CONFIRMATION in it.
FOLLOW FOR MORE DAILY ANALYSIS

SONIC - New altcoin, is 10x possible?SONIC is a new altcoin that has been listed on all major exchanges. I received many requests from you to do an analysis on it and if it's worth it to buy. First, let's take a look at fundamentals, then technicals.
The market cap is 202 million dollars ($202.91M) and is ranked #362. There is room to grow, as the market cap is not that high. As the coin is listed on major exchanges, it has relatively good liquidity, and you can trade it on the futures market. You can go long/short, and the volatility is extremely high. Pretty much every retail trader is addicted to volatility because if the coin is not moving, there are no opportunities. Always choose coins that move; you don't want to be stuck in the boring range.
Sonic is the first SVM network extension to launch on Solana, for games and applications. They are partners with Backpack, OKX Wallet, Metaplex, Pyth, Solayer, and more. The Solana network is getting popular, also with the latest TRUMP coin pump. They have 566k followers on Twitter and the number is rising pretty quickly.
Now, can this coin 10x? Yes, but this will definitely take some time. If you want to trade this coin, which I highly recommend due to its high volatility, you can take the following trade.
On the chart, you can see a descending channel, and I see an opportunity to go long on the next touch of it. Take profit is at the top of the channel or liquidity zone above the previous range, which you can see on the chart. Now, I am very curious - What do you think about this coin? Buy or sell? Let me know in the comment section. Thank you and have success!

SILVER - AB=CD - Bullish ContinuationFX:XAGUSD has formed ABCD which is a bullish continuation pattern. Price has found support at 0.5 Fib level during the retracement. I am expecting for price to find bullish momentum until 31.6, which is the target for this trade!

GOLD UPDATE TODAY
AronnoFX will not accept any liability for loss or damage as a result of
reliance on the information contained within this channel including
data, quotes, charts and buy/sell signals.
If you like this idea, do not forget to support with a like and follow.
Traders, if you like this idea or have your own opinion, please feel free command me.

Best Sell Area for BTC - Good opportunity and huge ProfitDear Traders,
i have 2 Bullish Scenario`s if price Try To Hit More HH ,
1-After Reach 113-115---> Dump to 93K --->Again Pump to 120-122 K
2- Break Double lines and Hit 120-122 K
Scenario 2 will be SAFE and have Huge profit ,
Very Safe Area for Sell : 120K-123 K
Sell Risky Area : 115000
Target 1 : 93000 $
If you enjoyed this forecast, please show your support with a like and comment. Your feedback is what drives me to keep creating valuable content."
Regards,
Alireza!

Alikze »» LINK| Bullish Wave 3 or C Scenario🔍 Technical analysis: Bullish Wave 3 or C Scenario - 1D
📣 BINANCE:LINKUSDT currency on the daily timeframe touched its targets in accordance with the analysis presented earlier, the scenario of the first of 3 bullish waves.
🟢 Chainlink touched its target after breaking out of the short-term descending channel.
🟢 It is currently in the supply zone on the daily and weekly timeframes.
💎Given the bullish momentum, this bullish leg, after breaking the supply zone, will have the ability to grow to the large supply zone of $60-$100.
💎In the first step after breaking the supply zone, the target will be $38 and $55.
»»»«««»»»«««»»»«««
Please support this idea 💡 with a LIKE 👍 and COMMENT 💬 if you find it useful and Click "Follow" on our profile if you'd like these trade ideas delivered straight to your email 📧 in the future.
Thanks for your continued support.🙏
Best Regards,❤️
Alikze.
»»»«««»»»«««»»»«««

Natural Gas Futures (4H) - ABCD Pattern Analysis and PRZ Levels"In this analysis of Natural Gas Futures (4H timeframe), we identify a bullish ABCD pattern that projects a Potential Reversal Zone (PRZ) around 394.5-395. Key highlights include:
ABCD Pattern: The 1.618 Fibonacci extension from the BC leg aligns with the PRZ.
Current Price Action: Natural Gas is trading around 368.6, indicating a strong upward momentum.
Key Levels:
Resistance at 394.5 (PRZ zone).
Support levels marked at 365.2, 364.3, and 361.5.
Strategy Insight:
Traders may look for potential shorting opportunities at the PRZ (394.5) with confirmations.
Alternatively, breakouts above 394.5 could indicate further bullish movement toward 400+ levels.
This setup is ideal for monitoring reversal or continuation scenarios. Keep an eye on volume and momentum indicators for better confirmation."

#ABUK Egyptian stock - great opportunity - great fundamental.#ABUK time frame 1 DAY
created 2 Bullish pattern ( Gartley and AB=CD ) , so we can see action price in this point but in anther hand we are in a downtrend targeted 41.00 to 35.00 especially EGX30 is negative .
Entry level at 48.00 to 48.30
Stop loss 47.50 ( loss may go to up -1.7% ) or 46.80 the last stand with loss -4%
First target at 51.75 ( with profit around 7% )
Second target 54.25 ( with profit around 12% )
Third target 56.00 ( with profit 15% )
NOTE : this data according to time frame I DAY , it`s may take period up to 3 months to achieve targets , you must study well the Alternative opportunities before invest in this stock .
In addition EGX30 is negative.
Its not an advice for investing only my vision according to the data on chart
Please consult your account manager before investing
Thanks and good luck

A Promising Setup with a 0.087 Stop—Key Levels to Watch!C98USDT: A Promising Setup with a 0.087 Stop—Key Levels to Watch! 🔵
This chart offers an exciting opportunity to craft a well-structured trade with a stop at 0.087 . I want to highlight the blue boxes —these zones could provide excellent entry points, but as always, confirmation is key.
Focus on Breakouts: Look for bullish breakouts on lower timeframes.
Use Essential Tools: Confirmation requires analyzing:
Cumulative Delta Volume (CDV) to detect active buyers.
Volume Profile to ensure strong demand.
Heatmap to identify liquidity patterns.
Need Guidance? Visit my profile to learn more about these techniques and how to apply them effectively.
Final Tip: Stay disciplined—don't trade without proper confirmation. Follow, comment, and boost for more insights like this! 🚀
Let me tell you, this is something special. These insights, these setups—they’re not just good; they’re game-changers. I've spent years refining my approach, and the results speak for themselves. People are always asking, "How do you spot these opportunities?" It’s simple: experience, clarity, and a focus on high-probability moves.
Want to know how I use heatmaps, cumulative volume delta, and volume footprint techniques to find demand zones with precision? I’m happy to share—just send me a message. No cost, no catch. I believe in helping people make smarter decisions.
Here are some of my recent analyses. Each one highlights key opportunities:
🚀 RENDERUSDT: Strategic Support Zones at the Blue Boxes +%45 Reaction
🎯 PUNDIXUSDT: Huge Opportunity | 250% Volume Spike - %60 Reaction Sniper Entry
🌐 CryptoMarkets TOTAL2: Support Zone
🚀 GMTUSDT: %35 FAST REJECTION FROM THE RED BOX
🎯 ZENUSDT.P: Patience & Profitability | %230 Reaction from the Sniper Entry
🎯 DEXEUSDT %180 Reaction with %9 Stop
🐶 DOGEUSDT.P: Next Move
🎨 RENDERUSDT.P: Opportunity of the Month
💎 ETHUSDT.P: Where to Retrace
🟢 BNBUSDT.P: Potential Surge
📊 BTC Dominance: Reaction Zone
🌊 WAVESUSDT.P: Demand Zone Potential
🟣 UNIUSDT.P: Long-Term Trade
🔵 XRPUSDT.P: Entry Zones
🔗 LINKUSDT.P: Follow The River
📈 BTCUSDT.P: Two Key Demand Zones
🟩 POLUSDT: Bullish Momentum
🌟 PENDLEUSDT.P: Where Opportunity Meets Precision
🔥 BTCUSDT.P: Liquidation of Highly Leveraged Longs
🌊 SOLUSDT.P: SOL's Dip - Your Opportunity
🐸 1000PEPEUSDT.P: Prime Bounce Zone Unlocked
🚀 ETHUSDT.P: Set to Explode - Don't Miss This Game Changer
🤖 IQUSDT: Smart Plan
⚡️ PONDUSDT: A Trade Not Taken Is Better Than a Losing One
💼 STMXUSDT: 2 Buying Areas
🐢 TURBOUSDT: Buy Zones and Buyer Presence
🌍 ICPUSDT.P: Massive Upside Potential | Check the Trade Update For Seeing Results
🟠 IDEXUSDT: Spot Buy Area | %26 Profit if You Trade with MSB
📌 USUALUSDT: Buyers Are Active + %70 Profit in Total
🌟 FORTHUSDT: Sniper Entry +%26 Reaction
🐳 QKCUSDT: Sniper Entry +%57 Reaction
📊 BTC.D: Retest of Key Area Highly Likely
This list? It’s just a small piece of what I’ve been working on. There’s so much more. Go check my profile, see the results for yourself. My goal is simple: provide value and help you win. If you’ve got questions, I’ve got answers. Let’s get to work!

Bitcoin is breaking down right now! (lifetime opportunity)Bitcoin is currently breaking down out of the head and shoulders pattern, as I expected in past weeks. The next support is 85k, and we can hit this support pretty quickly. Bitcoin is known for its huge volatility.
After we hit 85k, I expect Bitcoin to go up and retest the previous neckline of the HaS pattern, which is at around 91k! So you can make 2 trades in the short term. If you watch my posts, you know that 85k is a significant support level. It's the start of the FVG on the daily chart. Between 85k and 77k there is pretty much no price action. That means we can experience a huge flash crash. But let's be realistic: 85k is also a 20% correction from the ATH. Statistically, a 20% crash is when you want to put your buy orders.
1:1 FIB extension corresponds to the ABC correction. We are in Wave C of a corrective pattern.
Write a comment with your altcoin, and I will make an analysis for you in response. Also, please hit boost and follow for more ideas. Trading is not hard if you have a good coach! This is not a trade setup, as there is no stop-loss or profit target. I share my trades privately. Thank you, and I wish you successful trades!
