ETH/USD: Elliot Wave Analysis IIIn this 2nd section, I enfocous to talk about in weekly timeframe and to recall. this it's a study of Elliot Wave Analysis to know what happen in the macrotrend.
We forming in this range 2 times of ABC patten. And that point it's consolidation of the market. So, we would need to know if this zone it's distribution that we could to begin the bear market if Ethereum doesn't support above $1,800 USD. At the moment, what I know it's that Ethereum it's leading to the $1,800 USD price, in that weekly demand zone. And more interesting it's that in the RSI we forming a bearish divergence as the buying force it's weakness in this bullish trend.
Abcpattern

NAS100USD ABC BEARISH PATTERN NAS100USD Has formed an ABC bearish pattern on daily chart .
The price is trading below the entry level 14901.4 and is approaching its first target 13851.1 61.8% ABC
STP 15075.8
TP1 13851.1 61.8% ABC
TP2 13499.8 78.6% ABC
TP3 12997.4 100% SYMMETRY ABC

GBPUSD BULLISH ABC PATTERN GBPUSD has formed an ABC pattern on its daily chart.
The price is trading above the 38.2% ABC extension and approaching to its 1st target
1.37338 ABC 61.8% extension.
1.37508 is the neck line of the head and

EURUSD BULLISH ABC PATTERN EURUSD has formed an ABC pattern on its hourly chart.
The price is trading above the entry level
1.13331
💼 EL 1.13331
⚠️STP 1.12799
🎯TP1 1.15201
🎯TP2 1.15809
🎯TP3 1.1511

GBPAUD BULLISH ABC PATTERN GBPAUD has formed an ABC bullish pattern on its hourly chart.
The price is trading above the entry level EL 1.88734
💼 EL 1.88734
⚠️STP 1.88363
🎯TP1 1.90939
🎯TP2 1.91655
🎯

EURGBP ABC BULLISH PATTERN EURGBP has formed an ABC paterrn on its hourly chart.
The price is trading above the entry level 0.83740
💼 EL 0.83740
⚠️ STP 0.83653
🎯TTP1 0.84012
🎯TP2 0.84102
🎯TP3 0.84213

EURUSD BULLISH ABC PATTERN EURUSD is trading in ABC above the entry level and approaching its 1st target 🎯TP1 1.14239
💼 EL 1.13130
⚠️ STP 1.12793
🎯TP1 1.14239
🎯TP2 1.14626
🎯TP3 1.15115

BTC/USD: Weekly OutlookBitcoin forming this ABC pattern, It's mean a bullish signal right now. So, As I said in my previously analysis. Bitcoin could to leading to the bull market toward $63k zone.
This it's just my perspective!!1

Short term move for Vechain Once this ABC-pattern triggers vechain's bound to hit the .441 fib retracement. Bullish times ahead :)
Also just a massive fan of Vechain fundamentally.

FB - Meta Is Showing What Is About To Come In The Stock MarketIn case you've been living under the rock, on 3rd of Feb. at the market close FB has fallen instantaniously for 20% and is since then continued to drop. I am not gonna focus on the news even though they did play a role here. Something had to happen somewhere between those large market cap stock and it looks like FB is leading the crash.
Just so you know i don't believe the entire stock market is bearish yet, just some of the large market caps as this is where long term investors start to take profits first or rotate the money into still undervalued stocks like F (ford) or PTON for example, that haven't had their true bull run yet.
Trying to count elliott waves i think we are close to the bottom which should come somewhere in the upper middle of the 2017-2020 trading range ($180-210). After that a expect typical ABC retracement of some sort back to the 70% of the initial fall to $320 price area (.702 fib. retr. lvl.) before continuing the bearish journey.
I am not a financial advisor so non of this should be taken as a financial advise. Be well.
NASDAQ:FB

BTCUSDT : potential bearish pattern Hello everyone
Before we start a discussion, it is my pleasure to read your opinion on this post's comment section and support this idea with your likes if you enjoyed it!
BTCUSDT :
Bitcoin is printing a bearish ABC pattern, at the same time, the price reaches the upper line of the potential parallel channel.
I determine the most probable price and time reversal zone.
I used the time projection of wave A to estimate the end of wave C. Also, I used Fibonacci projection of wave A to determine the probable price reversal zone.
Let's look at USDT dominance chart to find out investors inclination to change their coins to USDT, and vice versa.
the price reaches a very important support zone, at the same time, it reaches the lower line of the potential channel.
Conclusion:
Bitcoin reaches a very important situation. These reasons produce higher level of risk for buyers. we have more evidence for bearish wave of BTC price.

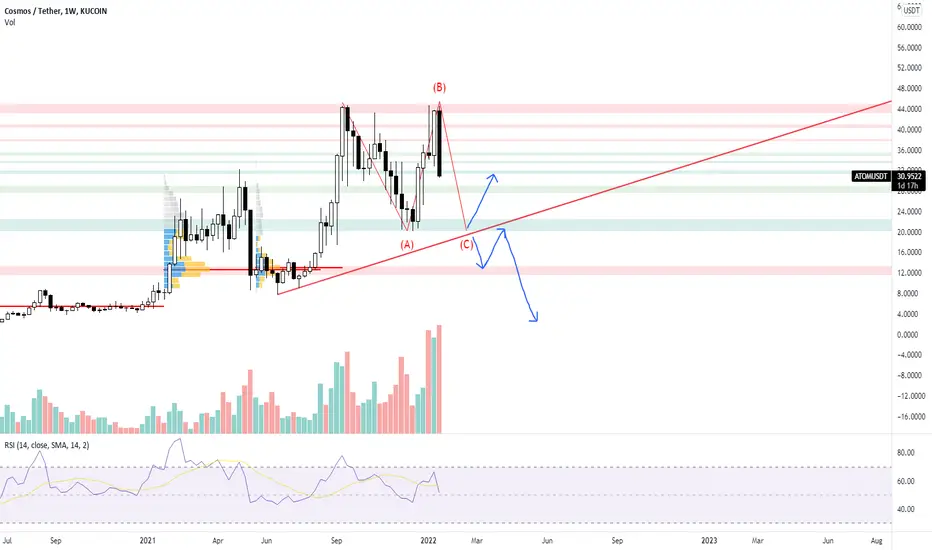
ATOMUSDT ABC structure on weekly chart? I'm looking at 2 scenarios, if the bullmarket will continue, we might drop to prices around 20$ and it could look like ABC structure and we should be going to new ATH's. Imo BTC is going somewhere below 30k (28-30k bottom) which means blood on ALT's if BTC-D goes up.
this is not financial advice ;)
BTCThe price, time, and pattern indicate the end of an ABC correction. I expect bitcoin to move to a new price top after that. Also, if this analysis is not accurate, I expect at least as much as 50% of the retracement fibonacci of the ABC pattern to rise, ie around 50,000.


BTCUSD - See you at 30K-25KThis is not an analysis. it's purely for educational and learning purposes.
Since, breaking the last support it's expected to reach next near support at 30K-25K area to finish correction pattern.

ABC completed with an SFP into a daily level, expecting new ATHC finally reached the 0.382 and made an sfp on 4hr TF taking the A low and all the stops under it touching perfectly that daily level in brown (last untouched daily of the range, significant), on 1hr TF we had a bounce on the 0.705 (typical institutional bounce), confluence here
and stochastic rsi bottomed on high TF, ideal condition for a bounce

East Tea HorseIn waiting, i gonna to drink a tea in the East America near of Horse.
So, see you next year !

S&P500 MAKE A NEW HIGH IN DECEMBER'21Contrary to my previous post(22/12) SPX surpassed 4656 and bulls again won the battle.
Now its turn for them to raise the index to 4918 before the end of the year.
It's very easy for them since lot of shorts drive this EOY rally.
ENJOY BULLS

On Holding Tries to Reclaim the 50-day SMASwiss sneaker company On Holding went public in mid-September for $24. It peaked near $56 in mid-November following a strong quarterly result and has now pulled back.
The first pattern on today’s chart is the 50-day simple moving average (SMA). ONON broke under that line in on December 13 as the retail sector crashed. But it’s chopped sideways since and yesterday closed back above it.
In the process it managed to reclaim its 8-day exponential moving average (EMA).
Next, ONON’s recent turn occurred near the bottom of the Keltner Channel. Price has also held $34.50, the low of its first trading session.
Third, stochastics are trying to climb back from oversold territory.
Finally, the pullback from the November highs represents a potential ABC correction pattern.
The fundamentals could also interest some investors after management cited “hyper-growth” and “significant pricing power” on its last quarterly call.
TradeStation is a pioneer in the trading industry, providing access to stocks, options, futures and cryptocurrencies. See our Overview for more.
Important Information
TradingView is not affiliated with TradeStation Securities Inc. or its affiliates. TradeStation Securities, Inc., TradeStation Crypto, Inc., and TradeStation Technologies, Inc. are each wholly owned subsidiaries of TradeStation Group, Inc., all operating, and providing products and services, under the TradeStation brand and trademark. When applying for, or purchasing, accounts, subscriptions, products and services, it is important that you know which company you will be dealing with. Please click here for further important information explaining what this means.
This content is for informational and educational purposes only. This is not a recommendation regarding any investment or investment strategy. Any opinions expressed herein are those of the author and do not represent the views or opinions of TradeStation or any of its affiliates.
Investing involves risks. Past performance, whether actual or indicated by historical tests of strategies, is no guarantee of future performance or success. There is a possibility that you may sustain a loss equal to or greater than your entire investment regardless of which asset class you trade (equities, options, futures, or digital assets); therefore, you should not invest or risk money that you cannot afford to lose. Before trading any asset class, first read the relevant risk disclosure statements on the Important Documents page, found here: www.tradestation.com .

More Rough Ride Ahead?This retracement has look and feel of a B wave, choppy and hesitant. Got a H&S in the 15 minute chart on 11/11.
Expect another leg lower soon IMO. Should push down to test support at the old ATH IMO. RSI went oversold, bounced, fades.
Likely to get a big bounce (arrow) after the C leg, retest ATH in December. 19 Nov OpeX likely to be pretty choppy IMO.
Sold off -300 pips and has bounced back a bit more than 200 of that in the AM lift. Now in descending stair-step pattern.
Measured move would end around 15815, give or take a bit. Selling could come at anytime, so unpredictable.
Wouldn't trade dailies on this as it might take a week to come off, could be tomorrow, who knows?!
I see lower lows and lower highs in daily charts on SPX, DJI. NQ looks like a sawblade fgs.
Opening position in ten QQQ 24 Nov 392Pp spread short the 15 Nov 382, net debit $4.12.
DYODD, GLTA!

Elliott Waves & 80K Bitcoin SoonLooks like were heading in to our 5th leg of this elliott wave pattern

Update Nitro gamesthe support did not hold on Nitro, no fundaments have been changed. The chart formed a ABC bearish Formation, but hopefully we will bounce off our last support where i placed the C.

Running flat ? The last correction before the hypercycle ?
This is a possible so Protect yourself not with condom of course.
