BTC big deep - big up to come?Dear Crypto friends,
we are facing a relatively crazy BTC moment, but as you know crypto is always a bit weird!
so after a big deep to almost 6500 BTC started to pump back, now at almost 7100, it will probably build an A-B-C correction to around 8K and afterward we are still expecting a dump lower.
MacD underbought and volume very high are a good reference to the next days pumps.
Stay tuned and like, share comment if you enjoyed the TA.
*this is just my opinion I'm not a professional advisor! Make your choices wisely and manage your risks!
Abcpattern


TELL THE TRUTH AND MAKE IT SIMPLEHi, i will make it simple in this chart. On the 1-day chart we see BTC bounced from the 61.8 retracement level, witch is an important level, when we are under this level it is a bearish sign! Above this level we could say market is moving to bullish but in fact we didnt do this we will go downer now.
IF we hit the 8234 level, witch you can see at the orange line by today we will move downer from there and
BTC will form the C of the bigger elliot correction waves, witch will bring us to around 4500 USD/BTC.
Please look how this chart plays out ;)
Thanks and good luck with your trades.

New ETC Wave StartingETC have been following a perfect Elliott Wave pattern. After the initial five waves ETC had a corrective ABC wave and again with a textbook 50% retraction to 0.0217 BTC. Now on the next wave and using the previous ratios the estimate is that wave 5 will move to 0.026 BTC by Friday close of business.
Weekends are notoriously bad in the Crypto trading world so there will highly likely be an ABC correction over the weekend before resuming its upward trend next week.
Do your homework and make your own decisions.

Exide Industries - Long Term View Wave Analysis : Long Term View : Exide Industries : 4th Wave : C Wave
Looking at chart looks like price in 4th wave completed b wave and c wave is going on which can be expected till 180-190 area.
After completing wave c we can last rise in the price around 324 - 350 max which very extended 5th waves and then sharp decline can been seen in the price in the future wiping out 50% of the price movement.
So, if top is 324/300 we can expect decline till 162/150.
There is no idea of time line so please ignore timing of the market, just trying to fit wave patterns in the current market movement.
Note: No trading recommendation for this analysis, just trying to figure out whats going on :)

Bullish on ADA/BTC - 1 HrGreetings Everyone,
Everything on this chart is heavily dependent on BTC -0.25% fluctuations.
ADA/BTC looks like it might be coming out of accumulation. Although major downtrend has not been broken, we may see a little green in between. Trade at your own risk. This should only be a buy on breakout confirmation in my opinion. Happy trading!

ABC correction to hit 54WTI has been in a long up trend and ready for a correction. This week their might be good entry point to enter short positions.

ABC correction in progress. 2018 is bearish.Hello everyone. After failed Bitcoin breakout and we can expect huge bearish movement down to 2k$. I don't see right now any bullish signs on my charts. I only post simplified chart of what we can expect from the market in 2018. So guys it is going to be tough times for bitcoin enthusiasts. If there are some signs of reversal I will post it. Stay tuned and hodl on!

BTC ANALYSISBearish short term but could be the end of the correction soon after 1 more wave down to complete the ABC correction.
New to the crypto game so helpful advice wouldn't go amiss

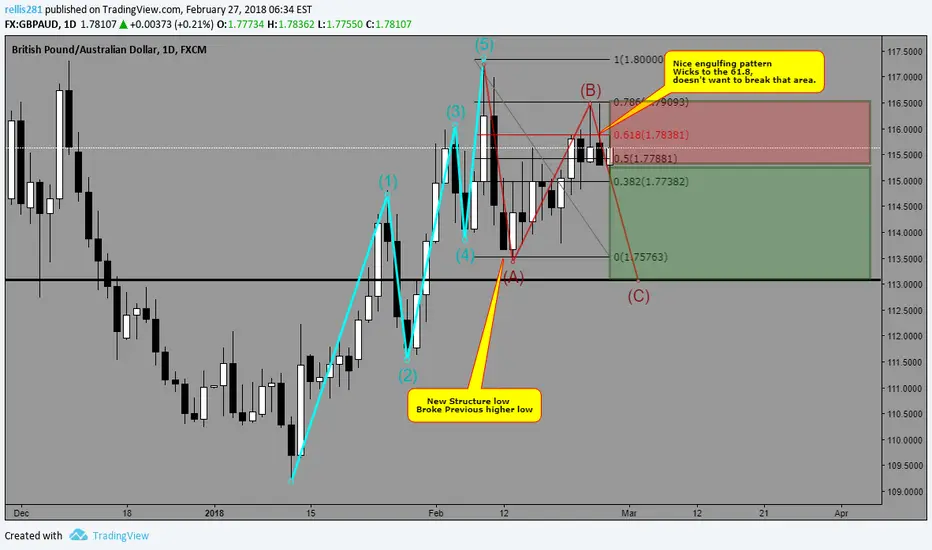
Possible 200 pip drop. (Abc Patern) Catch the C legNice engulfing pattern formed on Day chart, throwing wicks to the 61.8 on the day chart.
1:2 risk.
ETHEURHi guys
My only concern with ETH at the moment is that the drop in price from the recent highs could count as a 5 wave down. If correct then that could have been the minor count of an A wave, meaning that the B wave is underway which could end soon. If this proves to be correct then the C wave will cause ETH to drop lower than the A wave before ETH actually gets going to the upside again at a later stage. This looks like a classic ZigZag BUT as always this is just my view:)
*I used ETHEUR, the same thing is present on the ETHUSD pair.
All the best
Richard

GBP/AUDGA will either come down from here or it won't, but I'm in the sell. There is huge potential for downside if it makes a 5 wave out of this 3 wave. That's the whole point. I want this move to be a corrective 3 wave, which it currently looks like. That would mean I am looking for a 5 wave down. So.... was that a "C" ending diagonal and we are coming down?... Looks like it at least as of now


Bounce coming soon- end of ABC patternTrading setup:
-end of abc elliot wave pattern
- support bounce
-bullish divergence macd

btc ABC WAVEit's time to make correction ABC
Good time to make action in the futur is when the wave make the end

Litecoin day trade idealite coin bouncing off of a symmetrical Ascending triangle.
good entry at bottom of support.
stop loss if it falls under 235

ETH Classic Head and Shoulders? Initial Target = $660 On the hourly chart we can see a classic head and shoulder pattern playing out on ETH. At this time, we are completing the formation of the right shoulder. The neckline is noted with the red horizontal line, and the green horizontal line represents our target for the completion of this head and shoulders pattern. We got this target by measuring the distance between the neckline to the top of the head (orange arrow line) which gave us a measured move. We then copied the orange line and moved it to the breakdown point (neckline) to see the measured move down.
Coincidentally, this measured move is also the 161.8 fib retracement of Wave 1, which is normally where the 3rd Wave (in a 5-wave impulse) tends to end, and is another reason I believe this correction is not over. It is likely we are seeing a 5 wave impulse down, which is the A wave of another ABC zigzag lower (Ill go into more detail about this in another idea, but have drawn out the 5 wave impulse here as well for reference).

Bitcoin correction almost over! Elliot waves don't lieElliott waves do not always do exactly what they do, but patterns and the idea behind them do not change from the system. (www.trendfollowing.com) and
I counted the small lines for BTC -4.11% ABC correction and look above, the correction is almost done, if you view it from the Day-Chart.
We all know, elliott waves go 1st wave up, 2nd down, third up, fourth down, fifth to the top... ABC Correction follows. A almost as high as 4th waves, B around 3rd wave and C goes down below/around 2nd wave. We are there right now, if you check the big view. If you make the Chart smaller, you have 5 waves in the 1st wave, 3 waves mark the waves down to 2, 5 up to 3, 3 down to the number 4 of the waves and five go up to the high which marks 5...Down the ABC correction is 5 waves to A, 3 up to B, followed by 5 down to C.
If you make it smaller, you get 21 subwaves in the 1st wave up, 13 down to 2 etc...
ABC correction now: 21 down to A, 13 up to B and 21 down to C... On the chart I marked number 17 out of 21, so soon guys the ABC orrection is over. EMA also moving in and it will make a big bang up. Check out my Year analyzes. I know I do not have a big name on this homepage, but this will happen.
Thank me later if you like :)

EURUSD - Possible bat patternTechnically:
- Bullish bat pattern
- Strong SR zone
Entry marked on chart (1.2210-1.2220)
Final target profit marked on chart, we will adjust targets as we catch the bottom.
Trade reponsibly.

Bitcoin buying opportunity coming up!1-2-3-4-5 EW followed by A-B-Currently C wave correction
314 MA support ( red line)
long term trend line support (teal line)

USD/CHF SHORT 123We have got short 123 setup :)
Reasons for short:
Support acting as a resistance
Resistance Trendline
EMA
We are waiting for solid bearish PA!
Talk to you soon,
Marjan
Forex Swing Traders

FINAL ANALYSIS BITCOIN - 4H CHARTHey Traders,
This is my final view of BTC. It made the ABC structure I was expecting so now I am willing to confirm the upside. Lowest I think BTC will go is $8.5k applying mathematics on the chart.
-
Hey Traders,
Esta es mi visión final del BTC. Hizo la estructura que buscaba entonces ahora pretendo confirmar el recorrido alcista. Lo más bajo que veremos BTC pienso que son $8.5k aplicando relaciones matemáticas en la gráfica.
Carlos

Verge trade for next impulse(300-400% profit potentiality)According to coinmarketcap data,
there are 1476 coins/tokens involve in the crypto market.
almost 90% coin/token is fake.
they don't have any value or real purpose.
only around 150-200 coin/tokens are good for investors.
But blockchain is a revolutionary technology.
So when you would like to invest money in crypto market definitely you need to do some research.
I will post my analysis on which one has value.
Verge is one of them.
I am looking now next impulsive move.
