AVAXUSDT Trend Analysis | Will Volume Confirm the Next Big Move?AVAXUSDT Trend Analysis | Will Volume Confirm the Next Big Move?
🔍 Let’s break down the AVAX/USDT setup, examining its technical structure and mapping out key opportunities as it gears up for a decisive move.
⏳ Daily Overview
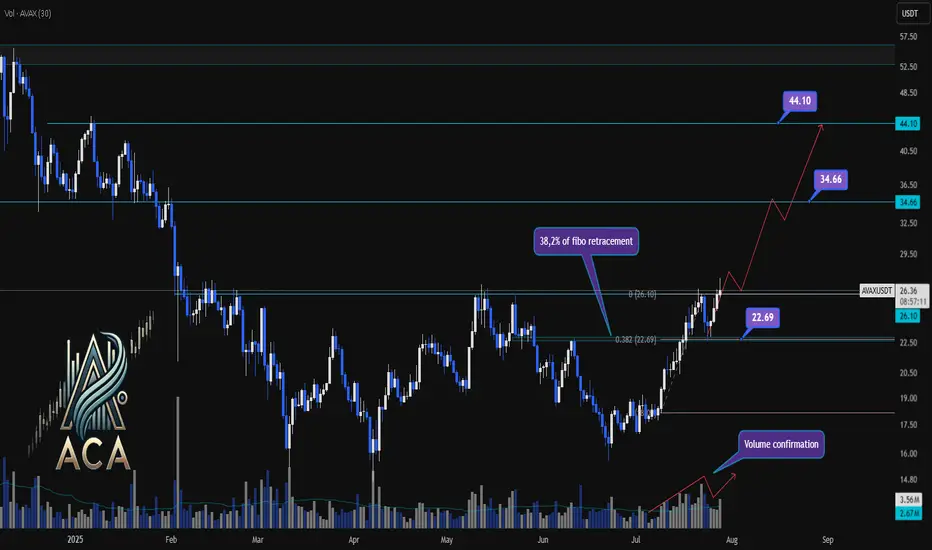
AVAXUSDT has been exhibiting a bullish structure, recently reacting to the 0.382 Fibonacci retracement level (around 22.69USDT) where price paused for a correction. This correction was technically healthy, as it occurred with declining volume, while upward impulses were marked by notable volume surges—signaling strong bullish participation and confirming accumulation phases.
🔺 Bullish Scenario:
The next area to watch is the resistance at 26.10USDT, which has acted as a major barrier in recent trading sessions. A decisive daily close above this level—preferably supported by a clear uptick in volume—would confirm breakout momentum and set the stage for further advances.
Upon confirmation, the chart points to medium- and long-term targets at 34.66USDT and eventually 44.10USDT. These levels are derived from key Fibonacci extensions and historic price reactions, offering logical take-profit zones for trend-following strategies.
📊 Key Highlights:
- 0.382 Fibonacci level (22.69USDT) acted as a reaction zone and healthy correction point.
- Volume profile validates trend: increased buying volume during upswings, decreased volume on dips.
- 26.10USDT is the next crucial resistance for confirmation.
- Breakout (with volume) opens path to 34.66USDT and 44.10USDT targets.
- Failure to clear 26.10USDT could result in consolidation or another retest lower.
🚨 Conclusion:
All eyes are on the 26.10USDT resistance. Wait for a clear daily close and volume confirmation before considering entries. A breakout above this level could propel AVAXUSDT towards higher Fibonacci targets, while a rejection may prompt another retest of prior supports or consolidation.
Stay sharp and plan your trades with discipline!
Academy
Trading Minest. Welcome to the most difficult game in the worldUnfortunately, you will be playing against some of the sharpest, fastest, smartest, most intelligent, well-informed, irrational, and, in many cases, unethical intellects in the world.
You are fighting a computer that reacts faster than you.
A trader who has more experience than you.
A fund that has more money than you.
An insider who has more information than you.
Others who misinform you.
An inner voice that will do everything it can to stop you.
So, give up your dreams of making a quick and easy buck.
Your first goal is survival.
Your first absolute goal is to learn how to stay in the game.
You can only do this by marking your territory.
By understanding how the competition thinks and acts.
By having a clear game plan.
And by choosing your attacks very, very carefully.
I've been sharing my knowledge on TradingView for years, but I'm sure this post will help you, too.
I want to talk about Trading Minest. After I set up a trading firm, I realized that this is the knowledge that most traders lack.
1. Survive at all costs
The higher your survival rate, the better trader you'll be.
If you disagree with that, you better give your money to me.
You don't have a survival instinct.
A strong survival instinct is an essential personal quality you must possess.
It teaches you to jump out of losing deals and hold on to winning ones with a dead grip.
That's what your inner attitude should be. It's essential because trading is all about survival.
It's also the essence of our lives.
2. You must be constantly afraid
You have to evaluate the opponent. If he is a stone, be water; if he is water, I will be a stone.
Maximize objective assessment of your opponent and adapt to him, but most people lack enough fear.
And if we don't have fear, we can open any trade.
And we won't use stop losses.
We're gonna do everything wrong.
And lose.
I want you to be afraid.
Example: If you are not afraid to lose, and we have the same trade, who will choose the more defensive tactic?
Whoever thinks I'm not afraid of all this nonsense, I have plenty of money. With that attitude, you will lose.
But if I am scared to death, I will use stops, watch what is happening in the market, and calculate my actions. But if a person has no fear, he will act recklessly, and then all of a sudden, bam, bam, and disaster will happen.
Many traders have lost money and committed suicide because they had no fear.
3.The ability to win when things aren't going well for you
The most essential quality of an athlete is the ability to score points when they need to catch up.
You should be able to win when you fall behind or have four losing trades; that is the difference between good traders and bad traders.
You say to yourself, "I'm behind; I'm not doing well."
And you have a choice to throw up the white flag and give up.
Or you can say, "To hell with it. I'm just gonna grit my teeth and get back in the ring and give it my best."
That's what your inner attitude should be.
You have to be able to win when you're behind.
You have to learn how to win when you're in a losing position.
That's how you have to set yourself up.
Otherwise, you will be in big trouble because no one can avoid losses in market trading.
And at some point, you are guaranteed to have a losing trade.
Only optimists can trade.
You're all so damn optimistic.
Because you think you can win a game, many people believe it's impossible. Many people say how much they lost in the market, but if they failed, someone made millions of dollars every year waiting for me to take money from the dealing. You're donating money to people who don't know the basic rules.
4. Use only proven methods
Do what works and don't do what doesn't work.
Reinforce the strong.
Best Regards, EXCAVO
_____________________
Disclosure: I am part of Trade Nation's Influencer program and receive a monthly fee for using their TradingView charts in my analysis.

#ACA/USDT#ACA
The price is moving in a descending channel on the 1-hour frame and is adhering to it well and is heading to break it strongly upwards and retest it
We have a bounce from the lower limit of the descending channel, this support is at a price of 0.0340
We have a downtrend on the RSI indicator that is about to break and retest, which supports the rise
We have a trend to stabilize above the moving average 100
Entry price 0.0377
First target 0.0404
Second target 0.0435
Third target 0.0474

BTC Bitcoin update 26 FEB 2025Memes sucked up all the liquidity.
At some point, a lot of crypto experts started screaming left and right that memes are mass adoption and a narrative for the future bull.
I've always said to be careful. That 99.98% of memes are casino, nothing more.
I've had many people start proving otherwise, but when I blow the question that stumps everyone, “If the token has no utility and no product, who will need to buy it when the buyer runs out? What happens to the token when the early investors start coming out ?” There is almost no one with a sensible answer to this.
Believe that everyone will hold the token, no one will lock in profits, and there will be an endless buyer.
To the question of whether you can make money? Yes, you can.
Statistics show that 7% are on the plus side, and 93% of holders are on the minus side. Are you sure you will not be that last buyer?
Today, I read an article about how one popular, successful influencer lost 700k in 3 weeks.
One by one :
TRUMP after Melania
Then crypto futures Ludomania.
After the apartment sale.
And lastly, LIBRA.
0 result, minus health, morals, and several years of life due to stress.
There are a lot of beautiful messages now that so-and-so wallet made so much on memes, so-and-so wallet made so much. Newcomers do not want to invest in fundamental projects; they want to get rich. As a result, they get into risky stories and lose their deposit completely.
Are there many among your acquaintances who have made good money on memes for their entire portfolio? I emphasize, on the whole portfolio of memes, and not once or twice catching the kush, which safely lost on the next bets?
There was leveraged futures trading that zeroed out newbies with no experience, now memes.
The alt season is a bit delayed because if you analyze the wallets, liquidity flows to the 1% of crypto people. And regular fundamental alts are not growing as there is trivially no buyer right now.
As I said earlier, when Bitcoin hits 120-140k.
130-150k, there will be massive profit taking, and more institutional capital will come in. Many people will start to move, and that's where the fundamentals will be bought up, which will cause the emergence of new retail on the crypto market.
But there's something else that needs to happen here.
The masses must be disappointed in memes and lose even more money so that the “new money” will go to the fundamental projects and not to phantoms.
Can I make money from memes? Yes, you can. But remember, you are not an investor here; you are just playing in a crypto casino.
Want more?
Everything is in the link below the chart
Best Regards EXCAVO

#ACA/USDT#ACA
The price is moving in a descending channel on the 4-hour frame and we are about to break it
We have a bounce from a major support area in green at 0.475
We have a downtrend on the RSI indicator that has been broken upwards
We have a trend to stabilize above the moving average 100 which supports the rise
Entry price 0.0705
First target 0.1083
Second target 0.1345
Third target 0.1695

XAUUSD Bearish Setup H1On this pair, we have a price that is consolidating between 2000 and 2020. My analysis suggests a short entry at the level of 2015.50, where we have a supply zone with a Point of Interest (POI) confirmed by 3 spikes and a descending trendline in which the price could make the third touch before descending towards the target of a 1:2 risk-reward ratio at 2000.
Let me know what you think.
Happy trading to everyone.
Forex48 Trading Academy

GBPJPY SHORT SETUP H1GBPJPY is presenting a bullish structure this morning. The price is approaching the 170.48 area, where we have a supply zone. At that point, the market formed a short setup on May 10th, confirmed by the Forex48 1.0 strategy. Additionally, the price at this point could bounce off a bearish trendline, completing the third touch. The target for the short entry is indicated in the 168 area.
Let me know what you think.
Happy trading to everyone.
Forex48 Trading Academy

GBPAUD Bullish Setup H1GBPAUD currently has a slightly bullish setup this morning after a strong decline last week. The objective is to wait for the trade at 1.8630, where there is a demand zone with three confirmations and a bullish setup for market entry in the highlighted yellow area.
Let me know your thoughts.
Happy trading to all.
Forex48 Trading Academy

CADJPY Two potential bearish setupsOn CADJPY, we have a bullish setup since Thursday. Currently, the price is around 100.70 and rapidly ascending. The expectation is for a bounce around 100.95, where we have a supply zone with a bearish setup identified by the Forex48 strategy. In addition to this potential entry, we have another one around 101.60. Both entries look promising; we will see which one the market favors.
Let me know your thoughts.
Happy trading to all.
Forex48 Trading Academy

GBPCHF Forex48 Strategy - Long SetupGBP/CHF presents a bearish scenario with a price approaching a demand zone created last week following a breakout of a triple candle high at H1 and M15, which is my personal strategy. The objective is to wait for the price in the 1.1084 area with a target of 1.12. Long Trade with RR 1:6.
Let me know in the comments what you think.
Good trading to all.
Forex48 Trading Academy.

BTC Next trading plan !! EternalTradingHello my name is Zoomber from EternalTrading and this is my next trading plan for BTC !
Hope you enjoy it !
Have a good trading and manage your risk!

xauusd shortHello
According to the current status of the symbol, I will enter the position and follow the capital management at this confirmation time

Ace Trading Academy - AUDJPY Chart and Trade Quick UpdateAUDJPY has been on a downtrend and as explained in previous videos has broken down from the support line drawn out. Once it broke down from the support line and the ascending channel it has made it moved toward the bearish strength. Watch this brief video for more knowledge on potential moves.
Ace Trading Academy
Like, Follow, Comment
(Drop any pair you want more analysis on!)

What are the parts of a trading strategy?What are the parts of a trading strategy?
I was doing a backtest on a new concept yesterday, and I realized the different parts of my testing strategy. At that moment, I became aware that the way I see any trading strategy is like an algorithm with several filters or steps. When those filters become "TRUE," we can check the following filter until we have a valid setup. Another way of understanding a trading strategy is like a funnel with different filters. At the end of the funnel, we have two possible outcomes.
Outcome 1. You are allowed to set pending orders.
Outcome 2. Do not place orders because one or more filters are not "TRUE."
Why am I writing about this? Because it was clear to me that even if you are doing it consciously or not, every strategy is like an algorithm; it doesn't matter if you trade manually. In the end, your brain is taking the price and making it go through a funnel of filters. So my intention today is that by putting together those different filters/stages/steps I realized yesterday, you can try to see them in your strategy and make improvements to your system or maybe become aware of something you have been doing.
It's important to say that this is a template, maybe you are using 2 filters, or perhaps you are using 5. The key point is understanding the step-by-step process that systematic strategies follow every time a setup is developed.
--------------------------------------------------------
FILTER 1: GENERAL CONTEXT
The most probable thing is that your first filter is about general context. What we are trying to answer here is, "Are we in a valid place for the strategy or not?" Some examples can be:
- The price must be in contact with a support/resistance zone.
- The price must be above/below (a certain technical level)
- The price must be on a drawdown of (time)
(TRUE / FALSE)?. IF true, proceed with the following filter; IF false, you are not allowed to trade.
--------------------------------------------------------
FILTER 2: SPECIFIC CONTEXT.
Now that your first filter is TRUE, the most probable thing is that you are using the 2nd filter regarding context; this is pretty similar to the previous filter but happens after the first one is true. Example:
- Moving averages should be in the following order...
- The price must be above/below (a certain secondary technical level)
- On a lower timeframe, the price must be (technical condition)
(TRUE / FALSE)?. IF true, proceed with the following filter; IF false, you are not allowed to trade.
--------------------------------------------------------
FILTER 3: FINAL CONTEXT BEFORE THE TRIGGER.
Here you will be paying attention to the final filter before the trigger; this is the last thing that, if TRUE, you will be able to wait for your trigger. Example:
- A technical indicator must be overbought/oversold.
- Volume at a certain level should be...
- I need to see a divergence.
(TRUE / FALSE)?. IF true, proceed with the following filter; IF false, you are not allowed to trade.
--------------------------------------------------------
FILTER 4: THE TRIGGER
All the filters are TRUE, and we are allowed to wait for the last thing before executing a setup, "The Trigger." Your trigger is a set of parameters that will enable you to place pending orders. Let's take a look at some of them:
- Candlestick Patterns
- Technical Structures (like Zig-Zag, Triangles, Irregulars, Flat, etc.)
(TRUE / FALSE)?. IF true + Risk to Reward ratio is aligned with the minimum requirements. Then set, Entry level / Stop level / Break-Even level / Take Profit level.
--------------------------------------------------------
My conclusion:
If I understand the different filters I'm using on my strategy, from general to specific ones, it becomes straightforward to make improvements or detect elements that require fixing. Instead of saying "My strategy is not working" or "My strategy requires improvements," we can say: My trigger is excellent. However, my filters regarding general context are not on point so I will work on that.
Understanding the parts of your trading strategy, like parts of an engine, will bring you insights into what you are doing. Try to see your system as a series of gears working together.
Thanks for reading!

#ACA BREAKOUT AND RETEST AND READY TO PUMP 60% !Hello, welcome to this ACA/USDT 4hr chart update by CRYPTOSANDERS.
I have tried my best to bring the best possible outcome to this chart.
Show some support do hit the like button, follow and comment in the comment section. this motivates me to bring this kind of chart analysis on regular basis.
CHART ANALYSIS :
#ACA/USDT
As we can see in the above-mentioned chart that ACA just broke the triangle pattern and currently moving down to retest so at the green zone or the upper trend line we can take a long position for almost 60% in the upcoming days.
Entry:- CMP and $1.490
Traget:- 60%
Stoploss:- $1.37
Remember:-This is not a piece of financial advice. All investment made by me is at my own risk and I am held responsible for my own profit and losses. So, do your own research before investing in this trade.
Happy trading.
Sorry for my English it is not my native language.
Do hit the like button if you like it and share your charts in the comments section.
Thank you...

The analysis of the behavior of major player Part 2Hey everyone.
Today i want to proceed my sharing of my knowlege about the behavior of large players in the market,
how to notice them and how to use it.
In the last tutorial we had a discussion about points where the major players places them SL and that this points it is = the biggest sales or buys in the market according the directions.
So today i want to show you this point on the chart in the major coin exactly.
Point of stop losses of major players is circled on the chart.
On this example we can see the major SL actuation like a BIG buy in the market!
Have an awesome deals 🤝🔥

ACA/USDT TRADE SETUP! READY TO PUMP 70%Hi guys, This is CryptoMojo, One of the most active trading view authors and fastest-growing communities.
Do consider following me for the latest updates and Long /Short calls on almost every exchange.
I post short mid and long-term trade setups too.
Let’s get to the chart!
I have tried my best to bring the best possible outcome in this chart, Do not consider it as financial advice.
LONG #ACA/USDT breakout this Ascending triangle pattern.
ENTRY: $1.4 to 1.44
SELL- 70%
STOP LOSS: $1.3
This chart is likely to help you in making better trade decisions, if it did do consider upvoting this chart.
Would also love to know your charts and views in the comment section.
Thank you

GBPAUD TRADE UPDATEI see GBPAUD heading lower and this is due to the Risk Off sentiment and it has already dropped 1400 pips previously and now it is tanking again.

Ace Trading Academy - AUDUSD Potential Bearish BreakAUDUSD has been on a short bull run respecting the trend line drawn out on the chart. The price has broke below the trend line and is now retesting the trend line. If the market stays below the trend line after a retest be expecting a drop to the point marked on the graph (.70450). Wait for a close of the candle below the breakthrough point for entry! Stay patient and happy trading!
Ace Trading Academy
Like, Follow, and Comment
Updates Posted Soon!

#GBPUSD |trading opportunityprice made a very clean push to the downside. now we have reached our reversal point. waiting for price to atleast give us a double bottom , before fully confirming all our long positions.

AUTOMATED TRADING BOTS: How to profit with Tezos.Tezos is one of the best token for our robot.
Our robot mainly uses the DCA (dollar cost averaging) trading method.
If the price drops, instead of the Stop loss order, we have a Buy limit order.
This will also cause the Take profit value to drop and approach the current price.
If the price falls and falls, the robot buys and buys. This keeps the Take Profit lower and lower.
After that, the price of the token rises and our trade ends with Take profit, which is not far from us thanks to constant and precisely predefined purchases.
The XTZ / USDT currency pair is suitable for our demonstration. You see very high volatility.
It is through volatility that our robot can be profitable. If the price still went in one direction without frequent fluctuations and without "waves", the robot would earn very little.
We need great volatility for big profits.
Volatility in the TradingView platform will be helped by the Historical Volatility indicator.
This indicator often (on this time frame) intersects the value of 50.00, which is rarely affected for low-volatile currency pairs. For example, you would look for Bitcoin very bad around 50.00 on this time frame.
The key to our profitable trading bot is volatility! At a time of market colapse, when almost everyone is going through and positions in the Futures markets are being liquidated on a large scale, we are EXTREMLY profitable thanks to our robots.
Of course, it is very important that you know how big the position is and how often, or at what intervals it is necessary for the robot to buy more. In no case is every setting of the robot profitable, on the contrary, setting up a profitable robot is not easy.
You will learn how to set up a robot to be constantly profitable in our Academy.
PS: One of the best things about trading with robots is that you remove all emotions and decisions.
We wish you a nice day. UCT team.

GOLD: XAU / USD Analysis (UPDATE). Very strong support!Hello TradingView Community!
Gold is at a very strong S/R level.
At first it functioned as a resistance, than for a long time as a support, then again as a resistance, and now the price has stopped by this level and again it functions as a support.
The price also reacts to the weekly Pivot point R1, from which it is reflected upwards.
At the moment, we prefer to be stay without a position on the Gold spot. It is possible to scalp in the direction of Long, but I would rather wait to see what the middle of the week and today's fundamental news will bring us.
Have a nice day. Your UCT Team.

BTC The Wave Principle | Diagonals + BreakoutsEasy setup for a quick trade, it's an ending diagonal + abc below the structure.
You get the Fibonacci retracement tool there and go for 618 retracement as entrance, and -0.272 | -0.618 profit levels.
Just try this in the past and see it for yourself: how many times does this combination of behavior has happened before?
Hello, I'm Lito.
I've been studying the wave principle for a while now, and I have found that price movement shows us the market behavior.
...what is this? people call it elliott theory, but it's a principle. that word means description of the behavior,
but to be more precise: human behavior.
Our emotions into charts, movements in dynamics ups and downs, in an oscillator=diagonalish increasing financial market.
impulses + corrections, on the move every single day.
Some are slow, some are fast. there are days and moments of fast movements, and then indecision and slower movements show up.
There are ways we can study this behavior and it's called The Wave Principle, the book Elliott Wave wrote about.
If you want to learn more about it, read this chart. There's a link there.
See ya.
ps. you can study the chart by following figures. If you don't recognize any of them, maybe you should watch my videos. Follow the link in the chart.
