Aurora Cannabis Inc.Cannabis stocks are looking juicy. 59 cents would of been sweet buy. To early to call for now.. put limit at low .
ACBFF


ACB - CRYSTAL BALLBlue triangle indicates the current range.
Green box is buy.
Red box is sell.
Blue line indicates potential support/resistance.
Green line indicates t/p.
This is a log chart.
This is not financial advice. All charts shown on my page, including this one, are just for fun.
If you enjoy my ideas please give this post a like and follow my page if you would like to see future posts! :)

acbacb :9.23-9.27 is VPOC
this levels must hold for longs and we go to 9.70 OR ELSE 8.50 AND 8.90$ LEVELS ARE PREVIOUS vpoc's( volume point of control) meaning where most volume has been traded and longs were in command
then 9.76 target#1
10.19
10.26
11$ and above....


acb.toacb.to : possibility of expanding flat or flat structure for consolidation before mosr upside...needs this pullback to attract more bulls


AURORA ACB - Repeating wave structure. Back to Highs in AprilAurora ACB is continuing within a 5 wave Elliot structure, repeating its performance from August to October 18 highs. We are currently in Wave 2 down to the .618 Fib level, before continuing the rally in wave 3. Indicators are as well showing the same signals as in the previous rally (pink circles).
Buy levels around 5.60-5.80 USD

ACB searching for support above the low of OctoberACB is positioned weak with a potential daily bear flag.
Key short term levels:
S: 7.92
R: 8.93

$ACB Short and then to the moooon!Going lower short term. Grab it at ~$6/7 and watch it fly for months.

ACB surges on Jeff Sessions' ResignationBig move today following a tweet buy President Trump that he has accepted the resignation of Attorney General Jeff Sessions
twitter.com
This came after a clear hourly bear break across the sector singling some daily consolidation was coming, but this breaking news clearly sidetracked that plan and delayed consolidation for at least a little while. I am closely watching for the hourly trend to change as the daily chart is very over extended right now
Key levels for tomorrow:
S: 9.59
R: 10.75, 11.29

ACB hourly uptrend on watchWatching the ACB hourly uptrend, the loss of which will signal healthy daily consolidation is coming. A break of Thursday's high of 9.28 will have us looking for bounce continuation.
Key levels:
S: 8.84
R: 9.28

ACB hourly equilibrium on watchThe oversold bounce is starting to feel toppy with a bearish reversal candle on the daily and declining volume. The high of the day rejected from the 100MA and we're in an hourly equilibrium now to determine if we're going to see bounce continuation or set a higher low on the daily chart.
I would also look towards Canopy for clues on how the sector leader breaks.
Key levels for hourly eq:
S: 8.63
R: 9.12
_____
For anybody looking at any individual stock it is imperative to keep an eye on the overall market and the analysis I do on SPY. The correlation of every individual name and sector to the market is very real and affects every stock you own.

Aurora bulls buy the gap down openQuick updates tonight.
ACB had a big gap down and giant bounce in the first 30 minutes of trading, and remained in an hourly equilibrium for the remainder of the day. Bulls made an attempt at a new high of day in late afternoon but came 4c shy of resistance.
The end of the day saw SPY with big bull move finishing up near the high of the day on the strength of both the tech sector and financial sector, while Canadian MJ was unable to derive any momentum from the this move. That does give some reason for concern with bulls being so close to resistance but unable to break it.
Tomorrow first thing the bulls want to break our two hourly resistances in order to see bounce continuation. Failure to do so a second time would be a red flag.
Key levels:
Support: 7.55
Resistance: 8.16, 8.20
If the bulls find the momentum to break this range and see continuation on the hourly bounce, we would look for a 4hr lower high compared to 11.29. There are numerous hourly resistances on the way up to that level, giving Aurora several more hurdles that Canopy and Aphria don't have to deal with.
_____
For anybody looking at any individual stock it is imperative to keep an eye on the overall market and the analysis I do on SPY. The correlation of every individual name and sector to the market is very real and the market has been showing significant weakness over the past four weeks. This correlation affects every stock you own.

Aurora nears daily oversoldACB continued its recent pattern of lower lows, dumping the whole day and closing down over 16% in one of the most stand-out bearish days this sector has seen. There is no doubt in my mind this weakness is in large part to the overall stock market dumping for the past four weeks, so be sure to keep an eye on the correlation to SPY. We've now given back 80% of the run up from August 14th to all time high over the past 10 trading days.
Where we stand, Aurora has a lack of support here. Regular readers know I anticipated a bounce before our key weekly level 7.65, which we broke today by 10 cents. This was very unlikely to happen, which speaks to just how weak this chart is. The daily RSI is approaching oversold, and is the lowest level it's been since August 14th. I'm now anticipating an oversold bounce.
Why do I anticipate a bounce in the very near future?
RSI levels on multiple timeframes are currently at or near historical bounce levels:
Daily - 30
4hr - 21
1hr - 21
If you did not stop out on one of the bear breaks over the past two weeks, now isn't the time you want to sell your position. Instead, you probably want to wait for a bounce to get underway, as we are likely to see at least a couple days of follow-through. Of course, if your mindset is to hold your position for years, then stop checking the price every day or you will drive yourself crazy. In my opinion, the bounce will not start until the CGC bounce starts....which will not start until the S&P bounce starts.
If you are one of the people who have asked me over the past couple months about a good time to buy Aurora, these conditions are ideal for starting to SLOWLY scale into a long term entry you plan to hold for years. Just be sure not to invest all your money at once. Keep in mind we have no more upcoming catalysts for the sector, and the correlation to the S&P500 could mean several months of continued downside for ACB.
I'm looking at the 1hr chart right now for our levels. We remain in a downtrend with clear lower highs and lower lows
Key levels to watch for trend change/continuation
Support: low of day 7.55, 6.67, 6.07
Resistance: 9.38, 9.88, 10.07
While Canopy and Aphria have a lack of resistance once they clear their two levels, Aurora has many more resistance levels to deal with.
_____
For anybody looking at any individual stock it is imperative to keep an eye on the overall market and the analysis I do on SPY. The correlation of every individual name and sector to the market is very real and the market has been showing significant weakness over the past four weeks. This correlation affects every stock you own.

ACB trying to hand on waiting for Canopy's breakAurora has a much weaker setup, and looks clearest to me on the hourly chart. Unlike Canopy, Aurora has broken down to lower lows although bulls are still buying the dip so far. Friday closed with weakness heading back down towards the end of the day. We remain in a clear hourly downtrend with lower highs of resistance on each little bounce.
The bear breaks on the hourly chart have so far been met with little followthrough as Canopy remains in its equilibrium. This correlation favours the Aurora bears; if Canopy breaks bearish, Aurora is well positioned for greater downside because of how much weaker the chart currently is.
ACB is also down close to the golden pocket retrace from the low of its August consolidation to new all time high, but has broken below the .65 unlike other names with stronger setups
Key levels for Monday
Support: 9.00
Resistance: 9.88
_____
For anybody looking at any individual stock it is imperative to keep an eye on the overall market. The correlation of every individual name and sector to the market is very real and the market is showing significant weakness over the past three weeks.

Watch ACB 4hr for short term momentumTaking a different approach today, starting with the long term weekly chart. ACB has a bearish reversal candle on the weekly chart and a potential volume climax. The weekly trend is not at risk of being lost anytime soon because of how hard we have run up. Our weekly support currently is at 7.65 and now that we've lost the daily uptrend we are in search of a new weekly support level. We have support with weekly MA20 and MA50 in the low $9 range. Update these levels weekly.
"So, what happened this past week?"
This is a question a few people have asked me in person and online over the past 24 hours. Let's go back to the daily chart to look at the setup we had going into last week.
Monday we saw continuation of the daily breakout from the previous Friday and finished strong at the high of the day. In almost every idea I've published over the past few weeks I've been reminding people that the sector has run over 100% in just a few weeks, and that was neither normal nor sustainable. Therefore, we were looking for a sell-the-news reaction to legalization. I was expecting that Wednesday and we got that on Tuesday instead, in the form of a gap up open, a volume climax and a bearish reversal candle. Wednesday and Thursday we saw a weak bounce attempt with a potential daily bear flag setup, with the low of Wednesday a must hold level. ACB has not yet lost that level, making it a stronger chart than Canopy which broke that level on Friday and confirmed the daily bear flag.
ACB currently sits within a daily range between 11.91 support and 14.36 resistance. On Friday we saw the bulls make an attempt at that resistance but fell short and dumped for the rest of the day, finishing close to the low of the day on increasing bear volume and looking to start with further weakness into next week. ACB has wicked below the daily MA20 but has yet to close below that level. The daily chart has broken below an RSI support line and the MACD is initiating the strongest bear move it's made since back in July. As I've mentioned we've already lost the daily uptrend; losing 11.91 support would initiate a daily downtrend with a lower high and a lower low on the daily chart.
The $9-10 range has good support with the MA50, MA100 and MA200 all overlapping in this range. Update these levels daily. With weekly and daily indicators all lining up, I would expect the bulls to defend this level on the longer term timeframe.
The 4hr chart shows the clearest details in my opinion.
Bulls are trying to hold 12.69 as the higher low in the 4hr equilibrium but we're not yet confident that our higher low is set. This is a tightening range that could continue for several days before we see a clear break of this pattern. I have no real interest in playing within this pattern because the action is generally choppy, and I know the break of these tightening ranges will carry significant momentum and followthrough for me to play either as a bull or a bear. Let's zoom in for more detail better explain why I anticipate further downside.
Looking into the hourly chart we see exactly why we have a setup for further weakness with an hourly bear flag. Friday we bottomed out when CGC hit hourly oversold and the sector saw very weak bounces on low volume when compared to the bear volume on the dump. Confirming that bear flag by breaking 12.69 means the bulls have not yet found their 4hr higher low and we will continue to look down towards 11.91 support. For anybody interested in playing within this range, the closer we get to 11.91 the better your Risk:Reward becomes as you have an entry much closer to your stop loss level.
If you're the type of person looking years out and holding, you don't care much about the last half of this post but you are very interested in the weekly chart above. While the weekly trend on ACB is not yet at risk Canopy will be testing that level on Monday. This signal from the sector leader gives you an opportunity to stop out and look to reload, for example, 10% more shares for 10% cheaper with the same amount of capital. That's one more way you can compound your gains on these positions even when we see consolidation on the longer term charts.
_____
For anybody looking at any individual stock it is imperative to keep an eye on the overall market. The correlation of every individual name and sector to SPY market is very real and the market is showing significant weakness over the past three weeks with warning signs of further potential weakness potential into next week.
By the way, I do analysis on the entire sector across all the mj charts I publish. If you're not looking at all the names I talk about, you're not getting the full sector-wide analysis. Follow me to get updates when I publish ideas and pay attention to the mj names you typically don't look at too, so you can stay in the know and get the full picture.

ACB sells the news into legalizationACB saw a big gap up and a big push in the first few minutes, followed by an aggressive dump spanning 20 minutes as traders took profit, knocking the stock down an immediate 16%. ACB bounced just five cents above former resistance 13.60 - former resistance now support.
The RSI also rejected from a downtrend line spanning the last few weeks. The MACD on the daily signals a very weak move from the daily breakout and the volume today looks like a volume climax - often a signal of a trend reversal.
We are very confident that on this pullback we will retain the daily uptrend and set a higher low above 12.50. Tomorrow I'll be watching for support at the low of today and at the daily EMA8.
Key support to hold is low of the day 13.65. Key resistance to break to tell us our daily higher low is in will be 14.96. On any continued bull push I do expect a lower high relative to our new all time high 16.24
We knew the rug was going to be pulled out at any moment, and I was caught a little off guard that it happened first thing this morning but luckily took profit on all my swings on the big gap up open. I do hope everyone heeded last night's advice to set your stop loss orders.
Big institutions have been loading large positions in Canopy with CIBC and Anonymous combined purchasing roughly $500 Million worth of shares in the past month. Be aware these whales can start unloading massive positions at any time without notice.
imgur.com

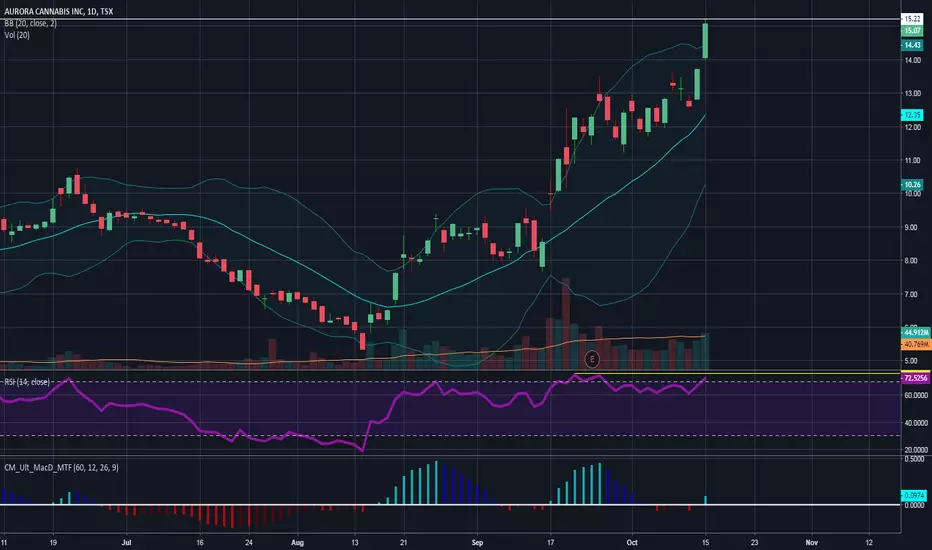
ACB double tops at all time high, needs follow-thru tomorrowACB saw a gap-up and run open this morning on big bull volume, continuing the daily breakout from Friday and finishing the day up 10%. ACB hit a new all time high today by two pennies but that's effectively a doubletop at 15.22 so the bulls are going to need more follow through tomorrow. That shouldn't be an issue, with a close up near the high of the day.We're riding well above the daily Upper Bollinger Band as support.
We see daily RSI has broke out of its channel and is approaching recent highs, and the MACD has started to curl up. We're looking for a higher MACD spike tomorrow.
When stocks are at all time highs there is a lack of resistance, so we look for psychological round numbers. $15.50, 16, 16.50 etc. $20, should we get there, will especially be tricky.
Our key support is 14.63 on the hourly. We also have a little support at 14.79, and 15 psychological.
Keep walking your stop losses up. We're in a euphoric bull run and we want to protect our profits from any sudden sell-off.
Also keep in mind the correlation to the overall market. SPY has its second daily inside bar to watch the range of tomorrow, and while a bearish end of day didn't affect the mj sector today, we have seen countless times where it has.
By the way, I do analysis on the entire sector across all the mj charts I publish. If you're not looking at all the names I talk about, you're not getting the full sector-wide analysis. Follow me to get updates when I publish ideas and pay attention to the mj names you typically don't look at too, so you can stay in the know and get the full picture.
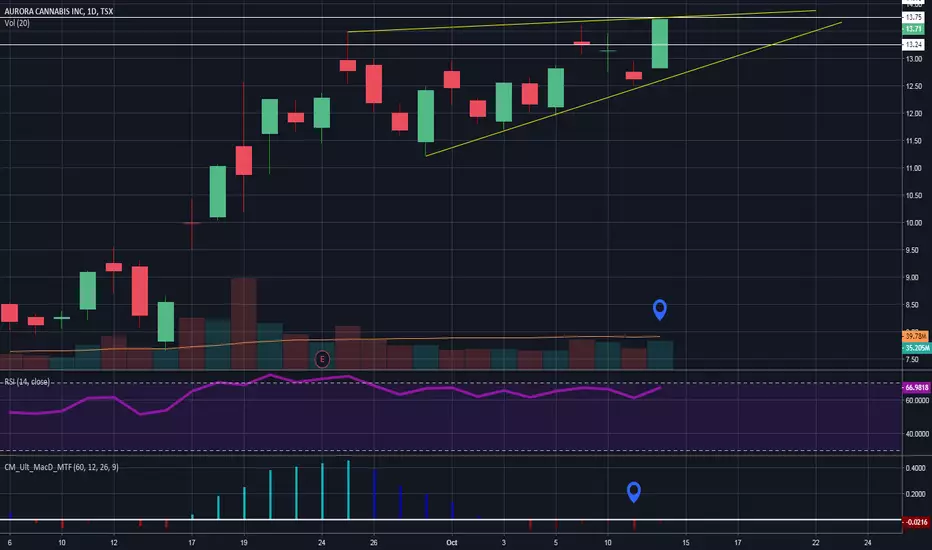
ACB the first in the sector to breakoutYesterday I pointed out that ACB needed to regain the hourly uptrend as a sign for a continued bull move. Anybody who acted on that signal had a very profitable day today! The key was 12.98 and if you bought that you would be up 6% already! ACB has been the most bullish chart for a couple weeks, and today saw that play out with a key break.
The key daily break today was the break of 13.60, which we saw on increasing bull volume today. I am concerned about two things, however. First, the MACD on this move up is very weak. Second, last time we broke resistance in the mid 13-range we saw no follow-through. Bulls will have to show us conviction of this break Monday on big bull volume in order to negate a potential ascending wedge pattern, as well as to give some confidence to this struggling MACD.
Our new must hold support to keep the bulls in charge is 13.24, and anything above this would be a higher low.
After today we only have three resistances left: 13.75, 14.10, and our all time high 15.20. As of close, we're only 11% away from that all time high.
CGC and APH also have very nice daily setups heading into next week; let's see if this ACB breakout will foreshadow what those names will do on Monday.
By the way, I do analysis on the entire sector across all the mj charts I publish. If you're not looking at all the names I talk about, you're not getting the full sector-wide analysis. Follow me to get updates when I publish ideas and pay attention to the mj names you typically don't look at too, so you can stay in the know and get the full picture.
ACB must change the hourly trendACB looked to be trying to print a daily bull flag but the pullback today and close near the low is more than enough to negate that in my mind. I find the clearest picture on the 1h4 chart where we have a clear downtrend of lower highs and lower lows.
Our lower high of resistance is the high of the afternoon bounce 12.90 and high of the day 12.94 but really I'm not interested until the price can break above $13.00 psychological reisistance. Key level on the hourly chart for the bulls to hold as step one in taking back control is 12.50. If we lose that level, I'll remain patient waiting for a new support to be found and watch the top of the subsequent move to see our new resistance level.
For the record, ACB has now given back 2/3 of the move subsequent to them filing their uplisting documents with the SEC.
For anybody looking at any stock keep an eye on the market. The correlation of every individual name and sector to the overrall market is real and the market saw an all-out dump today, having now given back over 3 months of gains in the past week.
By the way, I do analysis on the entire sector across all the mj charts I publish. If you're not looking at all the names I talk about, you're not getting the full sector-wide analysis. Follow me to get updates when I publish ideas and pay attention to the mj names you typically don't look at too, so you can stay in the know and get the full picture.

ACB moves on APH rumoursACB may have found it's new base of support at 12.75 when it broke the lower high pattern on a move that topped out at 13.45. We're looking at the hourly chart here as it offers the most clarity for me. I'm anticipating the bulls to form a higher low above 12.75 and will be watching the pullback for size and volume to consider the liklihood of forming an hourly equilibrium or seeing continuation.
Key range: 12.75 - 13.45
Note that today's move seems entirely related to APH run on news today, news that of course does not affect Aurora in the slightest. I'm not sure how that weighs into what happens next so we will just patiently said for our next long or short signal.
For anybody looking at any stock keep an eye on the market. The correlation of every individual name and sector to the overrall market is real and the market saw an all-out dump today, having now given back over 3 months of gains in the past week.
By the way, I do analysis on the entire sector across all the mj charts I publish. If you're not looking at all the names I talk about, you're not getting the full sector-wide analysis. Follow me to get updates when I publish ideas and pay attention to the mj names you typically don't look at too, so you can stay in the know and get the full picture.

Best Cannabis Play - SPRWF - FIRE - Undervalued - Set to ExplodeI wanted to re-sound the alarm on this, other people have said this stock is undervalued, and I am going to repeat their findings, this stock is grossly undervalued compared to its peers.
Everyone has been going all in on Aurora Cannabis, Canopy Growth, Aphria etc. Now is the time to trim your positions in the bigger cannabis companies and rotate it into Supreme Cannabis. Supreme has landed contracts with 6 provinces to supply liquor stores with their premium buds. Compared to Aurora who currently has 5 I believe (8-9 billion market cap). Supreme has been in production for approx. 12 months and has been fastest growing cannabis company of all time compared to other licensed producers growth rates. They achieved approx. 8 million in revenue first 12 months of production. Check their last 12 months news, its extremely impressive. Below are some notable findings.
"Supreme Cannabis signs supply agreement with Manitoba Liquor and Lotteries"
"Supreme Cannabis signs supply agreement with Alberta Gaming, liquor and Cannabis commission.
" Supreme Cannabis enters into MOU with British Columbia Liquor Distribution Board"
"Supreme Cannabis secures supply agreement for the Province of Ontario"
"Supreme Cannabis secures supply agreement with Nova Scotia Liquor and Prince Edward Island"
"Supreme Cannabis secures supply agreement with Tilray - 20 million
There supply capacity will balloon up to 50,000 KG in 2019. At $6000 per KG, they will be bringing in nearly $300 million revenue from max capacity.
Based on their current valuation of 400-500 million - Supreme Cannabis is grossly undervalued compared to its peers.
I predict a monster run from this stock over the next 12 months. I think Supreme has the ability to hit 10 per share in the right conditions.
