Massive Base Formation on Charts – Potential Multibagger LoadingThere are two Chart of HIMATSINGKA SEIDE.
Himatsingka Seide is forming a symmetrical broadening wedge pattern on the weekly timeframe, with a strong support zone near ₹100.
On the daily timeframe, Himatsingka Seide is forming an ascending broadening wedge pattern, with a crucial support level near ₹135.
If this level is Sustain then we may see higher prices in Himatsingka Seide.
Thank You !!
Accumulation

[Deep Dive] SUSHI – Edition 3: Accumulate. Anticipate. Accelerat🧠 Cycle Anatomy: What the Chart Is Telling Us
📉 Phase 1: Markdown
The bears dominated, slicing price downward into key historical support around the $0.50 mark — the same level that anchored the previous accumulation zone.
📦 Phase 2: Accumulation
Both accumulation phases (mid-2023 and Q2 2025) occurred near identical support zones, with rounded bases and sideways chop — signaling strong hands quietly absorbing supply.
📈 Phase 3: Markup Incoming?
Following breakout point “1” and retest point “2,” the current structure aligns remarkably well with the previous markup phase — which propelled SUSHI from ~$0.50 to over $3 in just weeks. While past performance isn’t a guarantee, this fractal deserves attention.
🔥 Why Fundamentals May Support This Move
- SushiSwap v3 continues rolling out on multiple chains, optimizing capital efficiency and fee structure for LPs.
- Governance has stabilized after the rough patches of 2022–2023, with more transparent treasury and development direction.
- Cross-chain expansion and integrations with major aggregators (like 1inch, Matcha, and DeBank) are boosting SUSHI’s visibility in the broader DeFi flow.
Additionally, a surge in TVL and DEX activity on low-fee chains could redirect volume back to SushiSwap — a platform known for its cross-chain capabilities.
📍 What to Watch Next
- A confirmed breakout above $1.00 would validate the “markup” thesis.
- A dip toward the $0.65–$0.70 zone could offer a high-risk/reward entry aligned with point “2.”
- Failure to hold the $0.50 level would invalidate the structure.
For now, the rhythm is clear: markdown → accumulation → markup. And if the pattern holds, SUSHI might just be preparing for its third vertical.
💬 Do you think this is just another fakeout — or is SUSHI gearing up for a DeFi comeback?
🔔 Disclaimer: This post is for educational and informational purposes only. It does not constitute financial advice. Always do your own research and manage risk carefully.
📚 Always follow your trading plan => including entry, risk management, and trade execution.
Good luck!
All strategies are good, if managed properly.
~ Richard Nasr

Long $BABA - NYSE:BABA is testing 200 SMA
- NYSE:BABA moves are explodes higher then cools then retest support then explodes higher than the last high. It's called trading with higher wavelength
-> Move 1: Started April 2024 when the trend reversal started. $68 -> $89 with around +30% then retraced $90 -> $72 ( -20% )
-> Move 2: July 2024, $72 -> $116 (+61%) then retraced $116 -> $80 ( -31% )
-> Move 3: Jan 2025, $80 -> $146 (+ 82.5%) then retraced $146 -> $108?? ( correction underway ) ~ -26% so far
-> Move 4: Likely from $100-105 to $180-200

GRAB 1W: Two Years of Silence — One Loud BreakoutGRAB 1W: When stocks go quiet for two years just to slap bears across both cheeks
The weekly chart of GRAB shows a textbook long-term accumulation. After spending nearly two years in a range between $2.88 and $4.64, the price is finally compressing into a symmetrical triangle. We’ve already seen a breakout of the descending trendline, a bullish retest, and the golden cross between MA50 and MA200. Volume is rising, and the visible profile shows clear demand with little resistance overhead.
The $4.31–$4.64 zone is key. Holding this level opens the path to $5.73 (1.0 Fibo), $6.51 (1.272), and $7.50 (1.618). The structure is clean, momentum is building, and this accumulation doesn’t smell like retail — it smells institutional.
Fundamentally, GRAB is a leading Southeast Asian tech platform combining ride-hailing, delivery, fintech, and financial services. Yes, it’s still unprofitable (–$485M net loss in 2024), but revenue is growing fast, recently crossing $2.3B. Adjusted EBITDA has been improving steadily, and the company holds $5.5B in cash equivalents with minimal debt — giving it excellent liquidity and expansion flexibility.
Valued at ~$18B, GRAB operates in the world’s fastest-growing digital market, with increasing institutional exposure from players like SoftBank and BlackRock. The 2-year base hints at smart money preparing for the next big move.
Tactical plan:
— Entry: by market
— Targets: $5.73 → $6.51 → $7.50
— Stop: below $4.00 or trendline
If a stock sleeps for 2 years and forms a golden cross — it’s not snoring, it’s preparing for liftoff. The only thing left? Don’t blink when it moves.

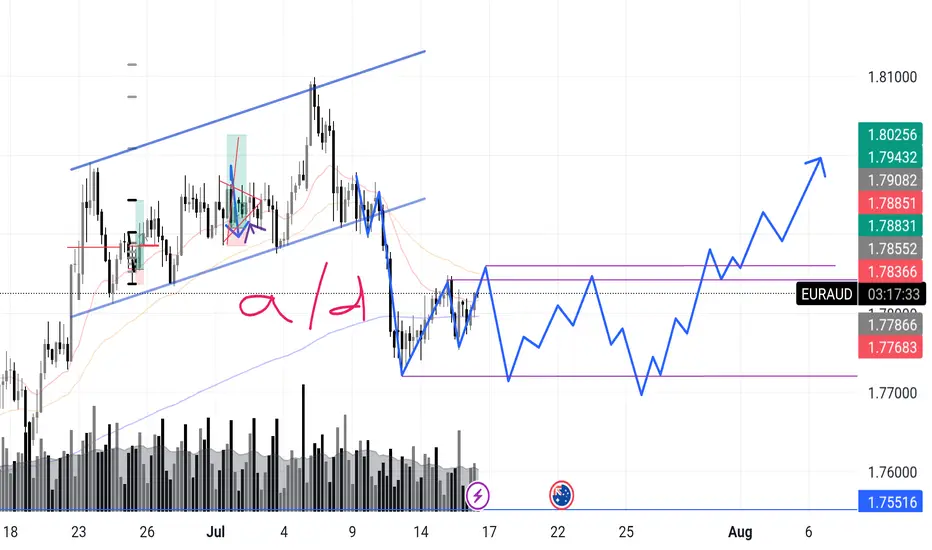
EURAUD – Incoming Upthrust? Accumulation or Distribution? Chart Context:
EURAUD recently completed a sharp markdown after a textbook rising channel break. What’s interesting now is that price has entered what looks like a potential box range between 1.7768 and 1.7885.
I'm anticipating a possible upthrust move into the 1.788x zone — and what follows will reveal the true intent.
Here’s the internal debate:
Are we looking at reaccumulation — smart money trapping shorts before driving higher in line with broader money flow?
Or is this a distribution — where the market builds a false sense of support before deeper downside?
🔍 What tips the scale for now is this:
>The overall money flow direction (via volume patterns + structure) has leaned bullish, so I’m favoring accumulation with a shakeout scenario.
Signs I’m watching:
✅ Absorption volume near the bottom of the range
✅ Higher lows inside the zone
✅ Fake breakout / upthrust into prior structure
❌ Failure to hold above 1.7855 could flip the bias short-term
📉 Expecting one more dip to test demand, followed by range tightening, and if buyers show up strong — the breakout can get explosive.
What’s your take?
Are we prepping for a markup or will this fakeout and roll over?
"I go long or short as close as I can to the danger point, and if the danger becomes real, I close out and take a small loss"
ACC Trade Setup for the Week(14–18 July 2025) – Uptrend ChannelACC Ltd. (NSE: ACC) has been trading inside a clean uptrend channel for the past few weeks, bouncing consistently between rising support and resistance. Now, it approaches a critical inflection point — the lower support of the channel.
While no breakdown has occurred yet, the structure is weakening, and a bearish opportunity may soon present itself. Let’s explore how to trade this if the setup confirms.
1. What’s Happening on the Chart?
ACC is trading close to the channel support zone (~₹1975).
The resistance zone near ₹2000–₹2020 has held strong.
A potential breakdown below the rising green support trendline could trigger a bearish move toward the ₹1910–₹1920 demand zone.
But nothing is confirmed yet — this is a watchlist setup.
2. Trade Setup – Conditional Bearish Opportunity
✅ Trade Plan:
Wait for breakdown of the rising support line.
After breakdown, wait for a re-test of the broken support zone (~₹1975–₹1980).
Look for bearish confirmation via a candlestick pattern (engulfing or strong rejection) on the 15-min or 1-hour timeframe.
🚨 Entry Trigger:
Only enter short if re-test holds and price starts reversing.
📉 Stop Loss:
SL should be above the re-test high (around ₹1990–₹1995).
🎯 Target:
Profit booking zone: ₹1910–₹1920.
Potential R:R: 1:2, 1:3, or even 1:4 depending on entry.
3. Why This Setup Matters
Trend exhaustion is visible near the upper resistance of the channel.
A clean breakdown + re-test gives a low-risk entry.
The 200 EMA lies near the target zone, providing confluence for mean reversion.
4. What If There’s No Breakdown?
If price respects the support and bounces again, no trade should be taken on the short side.
In that case, look for possible bullish reversal signals back toward channel resistance — or stay neutral.
5. Final Thoughts
This is a highly conditional setup — and patience is the key. Don’t jump the gun. The best trades happen after confirmation.
🔔 What to watch this week:
Breakdown below ₹1975 support
Re-test and rejection from ₹1975–₹1985
Confirmation candle (bearish engulfing)
Only then consider a short trade toward ₹1910 with a well-placed SL.
Plan your trade. Wait for structure. Trade only when the market shows its hand.

WIF — Accumulation Bounce & FVG Target1. Buy in accumulation range ($0.61–0.78)
2. Confirm entry after bounce/hold
3. Main target: $2.35 (Weekly FVG)
4. Stop: below $0.61 — scenario invalid

Sonic (FTM) — RR Sweep & Accumulation Setup1. Wait for full sweep of weak lows (target $0.15)
2. Enter long only after reclaim above support zone
3. Macro target: $3.47+
4. If no strong low or reclaim, stay flat

Bitcoin Uptrend Momentum, Key Buy Zone at 106.3K–105.9K__________________________________________________________________________________
Technical Overview – Summary Points
__________________________________________________________________________________
Momentum : Uptrend confirmed across all timeframes ≥1H; no signs of exhaustion or overheating.
Major supports : 106,319, 99,581, 98,133 USD
Major resistances : 108,239, 108,685, 111,949 USD (ATH)
Volume : Normal on higher TFs, very high on 30min/15min (potential breakout or institutional shake-out).
Behavior : Risk On / Risk Off Indicator = Strong Buy from 1D to 1H, neutral on 15min; ISPD DIV neutral across all TFs (no extreme behaviors).
__________________________________________________________________________________
Strategic Summary
__________________________________________________________________________________
Bias : Bullish as long as 98,133 is held on daily closes; structural buying pressure confirmed.
Opportunities : Swing accumulation on pullbacks to 106,319–105,900; targeting 108,700 then 111,949 on breakouts.
Risk : Geopolitical catalyst or break below D Pivot Low 98,133.
Macro catalyst : No major events (Fed, CPI, NFP) over the next 48h. Watch Powell’s speech (2 July).
Action Plan : Long entry on pullback to 106,300–105,900, stop <105,900, targets at 108,700 then 111,900. Exit on daily close below 98,133.
__________________________________________________________________________________
Multi-Timeframe Analysis
__________________________________________________________________________________
1D – Daily : Strong uptrend; balanced volumes; supports at 98,134 / 99,581; resistance at 108,239–111,949.
12H/6H/4H : Positive confluence. Accumulate on any return to support; no behavioral excesses detected.
2H–1H : Rising volumes, no divergences; strong timing for entries on dips.
30min/15min : Very high volume (breakout/shake-out); structure remains bullish. 15min Risk On / Risk Off Indicator =Neutral → watch for short-term consolidation or traps but broader trend holds.
Clear bullish confluence on all TFs ≥1H, with no behavioral or macro warning.
Short-term risks on micro-TFs (extreme volume, possible shake-out).
Accumulation zone on 106,300–105,900 pullbacks, invalidation below 98,133.
__________________________________________________________________________________
Cross-Analysis & Strategic Synthesis
__________________________________________________________________________________
Trend : No reversal signals. All indicators (volume, price action, Risk On / Risk Off Indicator) point to trend continuation.
Macro & newsflow : Monetary status quo, no negative catalyst in the short term. Only open risk: geopolitical tensions, closely monitored.
On-chain & fund flows : Ongoing ETF inflows, stable capitals, strong HODL trend, SSR stable.
Risk management : Stop <105,900, hedge on geopolitical signals.
Summary:
All TFs ≥1H aligned in bullish cycle, corrections = structured long accumulation opportunities.
Key buy zone: 106,300 – 105,900; prudent stop <105,900; main targets 108,700 and ATH.
Closely monitor for Powell/Fed headlines.
__________________________________________________________________________________

Bitcoin – Entering a distribution phase after a bull trap?Since the second week of May, Bitcoin (BTC) has exhibited a textbook accumulation phase, with a well-defined trading range forming just below the previous all-time high. Beginning around May 12, price action became increasingly compressed, marked by a series of higher lows and relatively flat resistance, indicating growing demand and waning selling pressure. This consolidation structure persisted for more than a week, suggesting that larger players were accumulating positions in anticipation of a breakout. Now it could be making the Power of 3. Accumulation, manipulation and distribution.
Accumulation, manipulation and distribution
Eventually, this coiled energy resolved to the upside. BTC broke through the upper boundary of the accumulation zone with increasing volume and momentum, triggering a sharp rally and leading to the formation of a new all-time high. At that point, market sentiment turned decidedly bullish, with breakout traders entering the market, expecting continuation. However, the price failed to sustain above the previous ATH for long. Despite the breakout’s initial strength, Bitcoin was unable to establish a solid foothold above the critical psychological and technical level, which has now proven to be a key inflection point.
Soon after setting a new high, BTC began to reverse, shedding gains and retracing back below the former resistance level, which had temporarily acted as support. The breakdown below the $106,000 mark, previously the ceiling of the accumulation range, signaled a notable shift in market structure. What was initially viewed as a healthy continuation pattern evolved into what now appears to be a classic bull trap. This type of failed breakout often leaves market participants vulnerable, as late buyers are caught in drawdowns and early longs may be incentivized to exit positions.
Given this context, the recent price action carries the hallmarks of a Power of 3, where market makers and institutions may be offloading positions to less informed participants. This phase is often mistaken for continued accumulation by retail traders due to its structural similarity; however, the key difference lies in the failure to maintain new highs and the emergence of lower highs on any attempted bounce. The rejection above the ATH and the subsequent breakdown below $106K has introduced significant overhead supply, which may act as resistance in the near term.
Target levels
As BTC continues to trade below this critical level, the likelihood of a further retracement grows. The market appears to be transitioning into a phase of redistribution or distribution proper, where price is likely to be capped on rallies and pressured lower over time. It is reasonable to expect that Bitcoin could revisit $100.000 to mid-$90,000s, an area that may serve as a magnet for liquidity and a potential staging ground for the next major move. This region could represent a "Last Point of Supply" (LPSY) within the Wyckoff framework, typically the final area where smart money distributes before initiating a more decisive markdown phase.
Nevertheless, this potential pullback should not be viewed solely as a sign of weakness. In many bull cycles, such corrections and shakeouts serve to flush out over-leveraged positions and reset sentiment, ultimately laying the groundwork for renewed upward momentum. Should BTC find stability and demand re-emerge in the $95K–$100K range, it could mark the beginning of a new re-accumulation phase, leading to a healthier and more sustainable advance.
Conclusion
In summary, the recent breakout above ATH followed by a sharp reversal and loss of key support paints a cautionary picture in the short term. Bitcoin may currently be navigating a distribution zone, with downside pressure likely to persist as the market digests recent gains. However, such corrections are typical in broader uptrends and often present opportunities for strategic entries once the next accumulation structure becomes clear. Patience and disciplined observation will be essential as the market defines its next directional bias.
Thanks for your support.
- Make sure to follow me so you don't miss out on the next analysis!
- Drop a like and leave a comment!

BTC Log Trend accumulation/expansionnoticed this Accumulation/Expansion/Contraction idea when trending along the Log Pitchfork lines.
and the high correlation to SPX (and M2) for direction.

Mastering the ICT Power of 3 concept - How to use it in trading!The financial markets often appear chaotic and unpredictable, but behind the scenes, institutional players operate with clear strategies that shape price action. One such strategy is the ICT (Inner Circle Trader) "Power of 3" model, a framework used to understand and anticipate market cycles through three key phases: accumulation, manipulation, and distribution. This guide will break down each of these phases in detail, explaining how smart money operates and how retail traders can align themselves with the true direction of the market.
What will be discussed?
- The 3 phases
- Examples of the PO3
- How to trade the PO3
- Tips for trading the PO3
The 3 phases
Accumulation
The Accumulation Phase in the ICT "Power of 3" model refers to the initial stage of a market cycle where institutional or "smart money" participants quietly build their positions. During this time, price typically moves sideways within a tight range, often showing little to no clear direction. This is intentional. The market appears quiet or indecisive, which is designed to confuse retail traders and keep them out of alignment with the real intentions of the market's larger players.
In this phase, smart money is not looking to move the market dramatically. Instead, they are focused on accumulating long or short positions without drawing attention. They do this by keeping price contained within a consolidation zone. The idea is to gather enough liquidity, often from unsuspecting retail traders entering early breakout trades or trying to trade the range, before making a more aggressive move.
Manipulation
The Manipulation Phase in the ICT "Power of 3" model is the second stage that follows accumulation. This phase is where smart money deliberately moves the market in the opposite direction of their intended move to trigger retail stop losses, induce emotional decisions, and create liquidity.
After price has consolidated during accumulation, many retail traders are either already positioned or have orders waiting just outside the range, either stop losses from those trading the range or breakout orders from those anticipating a directional move. The manipulation phase exploits this positioning. Price will often break out of the accumulation range in one direction, appearing to confirm a new trend. This move is designed to look convincing, it might even come with a spike in volume or momentum to draw traders in.
However, this breakout is a false move. It doesn’t represent the true intention of smart money. Instead, it's meant to sweep liquidity, triggering stop losses above or below the range, and then reverse sharply. This stop run provides the liquidity needed for large players to finalize their positions at optimal prices. Once enough liquidity is collected, and retail traders are caught offside, the real move begins.
Distribution
The Distribution Phase in the ICT "Power of 3" model is the final stage of the cycle, following accumulation and manipulation. This is where the true intention of smart money is revealed, and the market makes a sustained, directional move, either bullish or bearish. Unlike the earlier phases, distribution is marked by clear price expansion, increased volatility, and decisive momentum.
After smart money has accumulated positions and shaken out retail traders through manipulation, they have the liquidity and positioning needed to drive the market in their desired direction. The distribution phase is where these positions are "distributed" into the broader market, meaning, institutions begin to offload their positions into the retail flow that is now chasing the move. Retail traders, seeing the strong trend, often jump in late, providing the liquidity for smart money to exit profitably.
This phase is typically what retail traders perceive as the real trend, and in a sense, it is. However, by the time the trend is obvious, smart money has already entered during accumulation and profited from the manipulation. What appears to be a breakout or trend continuation to most retail participants is actually the final leg of the smart money’s strategy. They are now unloading their positions while price continues to expand.
Examples of the Power of 3
How to trade the PO3?
Start by identifying a clear accumulation range. This typically happens during the Asian session or the early part of the London session. Price moves sideways, forming a consolidation zone. Your job here isn’t to trade, but to observe. Draw horizontal lines marking the high and low of the range. These become your key liquidity zones.
Next, anticipate the manipulation phase, which usually occurs during the London session or at the NY open. Price will often break out of the range, triggering stop losses above the high or below the low of the accumulation zone. This move is deceptive, it is not the real trend. Do not chase it. Instead, wait for signs of rejection, such as a sharp reversal after the liquidity grab, imbalance filling, or a shift in market structure on a lower timeframe (like a 1- or 5-minute chart).
Once manipulation has swept liquidity and price starts showing signs of reversing back inside the range or beyond, you now look for a confirmation of the true move, this begins the distribution phase. You enter in the direction opposite of the manipulation move, ideally once price breaks a structure level confirming that smart money has taken control.
For example, if price consolidates overnight, fakes a move to the downside (running sell stops), and then quickly reverses and breaks above a key swing high, that's your signal that the true move is likely up. Enter after the break and retest of structure, using a tight stop loss below the recent low. Your target should be based on liquidity pools, fair value gaps, or higher-timeframe imbalances.
The key to trading the Power of 3 is patience and precision. You're not trying to catch every move, but to wait for the market to complete its cycle of deception and then ride the clean expansion. Ideally, your entry comes just after manipulation, and you hold through the distribution/expansion phase, taking partials at key liquidity levels along the way.
Tips for trading the PO3
1. Learn price movements
Before you can effectively apply the ICT Power of 3 strategy, it’s crucial to have a deep understanding of how price behaves. This means being comfortable identifying market structure, recognizing trend direction, and interpreting candlestick dynamics. Since the Power of 3 is deeply rooted in how price moves in real time, a strong grasp of these basics will give you the confidence to read the market correctly as each phase develops.
2. Analyse multiple timeframes
Although the Power of 3 pattern shows up on lower timeframes, relying on just one can lead to misreads. You’ll gain a clearer picture when you align the short-term view with higher timeframe structure. For example, what appears to be accumulation on the 15-minute chart may simply be a retracement in a larger trend on the 1-hour or daily. By examining multiple timeframes together, you can better identify the true setup and avoid being tricked by noise.
3. Exercise patience
A key part of trading the Power of 3 is knowing when to act, and more importantly, when not to. It’s easy to get impatient during the accumulation or manipulation phases, but entering too early often leads to frustration or losses. True discipline comes from waiting for the expansion or distribution phase, when the market reveals its real direction. This is where the most favorable risk-to-reward setups occur.
Thanks for your support.
- Make sure to follow me so you don't miss out on the next analysis!
- Drop a like and leave a comment!

ETH long signalETH looks great for short term trade.
*Depends on how the market will behave during this week*

USDCHF - BUY CALL - Divergence + wedge pattern + Accumulation USDCHF - currently the pair is in consolidation phase, followed by RSI Bullish Divergence and A wedge pattern. These two formations followed by a Bearish trend gives us an indication that market will take a bull run after accumulating positions.
we plan our entry as follows.
Entry Point : After break of Resistance level (LH)
TP1 : with a risk to reward of 1:1
TP2 : 1:2 Risk to Reward
Stop LOSS : slightly below the LL of bearish trend.

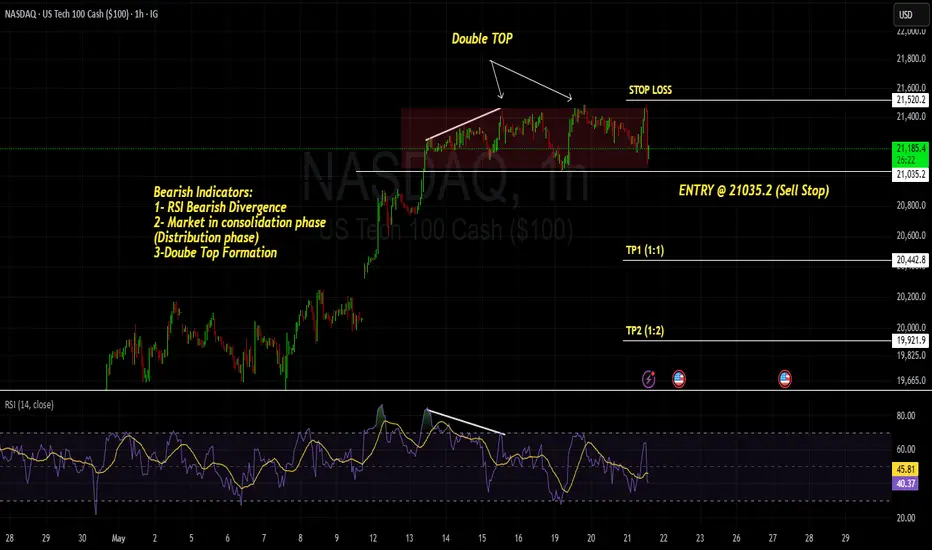
NASDAQ - SHORT SELL - AMAZING DOUBLE TOP PATTERN - REVERSAL patNASDAQ ; after forming series of HH and HLs is seem to be in distribution phase, we can see Divergence on RSI followed by Double TOP pattern which is a strong confluence for Reversal Pattern
we have a trade plan with our entry , once the accumulation phase (strong support) is broken as mentioned as ENTRY POINT (Sell Stop order) once our order is triggered we can place STOP loss above HL (or Resistance level) -
Our TPs would be TP1 with a Risk to Reward Ration 1:1 and other TP2 with R:R 1:2.
HAPPY TRADING GUYZ !!!!
"Better Trade your psychology and emotions, you will always be profitable"
Regards,
PROTRADEPROFESSOR
AVAX/USDT Potential UpsidesHey Traders, in today's trading session we are monitoring AVAX/USDT for a buying opportunity around 21.00 zone, AVAX/USDT is trading in an uptrend and currently is in a correction phase in which it is approaching the trend at 21.00 support and resistance area.
Trade safe, Joe.

BTC/USDT 4H – Bull Flag Breakout SetupA symmetrical triangle has resolved to the upside, confirming a bull flag breakout in line with the prior uptrend. Current momentum is supported by:
* RSI breakout above 60
* Price above mid-Bollinger Band and 55 SMA
* Breakout candle closing above triangle resistance (Yet to confirm)
**Targets:**
TP1: 108,000 – nearest horizontal resistance
TP2: 112,700 – flagpole projection from 104.5K breakout
TP3: Trailing target with 1.0% callback from breakout zone
**Stop Loss:**
Below triangle apex (\~103,000) or 55 SMA (\~103,480), depending on which is closer
**Volume:**
Still below average but RSI confirms bullish momentum. Watching for volume follow-through to confirm strength.
**Wyckoff context:**
Potential Phase D in a re-accumulation range, with breakout as Sign of Strength (SOS) after a spring-like consolidation.
This breakout is being monitored as part of a continuation setup toward 112.7K with proper risk management in place.

$GRAB Long Term Trade IdeaTaxi and delivery service stocks all look bullish at the moment. Lyft and Grab are both a couple of my favorite longer term swing trade/investment plays just based off risk/reward and how beaten down both the stocks are.
If shown patience this trade could work wonders. I like it a lot because it gets me a little exposure to assets outside the U.S. and from a chart perspective its hard not to love a setup like this.
1. The buy side volume shown here is the highest its ever been for the stock by a long shot.
2. Price has been in a descending wedge type formation for several months now and is attempting to make a breakout, though this month's candle still has a lot of time left.
3. That hammer candle, especially considering it being printed on the 1M timeframe, is incredibly bullish in my eyes.
This chart reminds me a lot of NYSE:BABA but a bit earlier in its breakout stages. To me it is clear that accumulation has been taking place for over 2 years now and a big markup is upon us.
I have 3 take profit areas marked based off a few different Fibonacci levels I like that also have confluence with supply/demand dynamics present on the chart.
multiple daily/weekly candles below $4 could be a a good stop loss area as that would invalidate a lot of the bullish structure. Based off the current price this provides you with a minimum 2.75x RR trade and a maximum of 7x RR.
My average price is $4.25. Any pullbacks below $4.50 I will be looking at as great buying opportunities.
Will do my best to update this idea periodically over the next year or so.

USDCADRange Breakout: The pair has been trading within a range, and the breakout from this range signals potential bullish momentum. A breakout indicates that the price is ready to move out of its consolidation phase, with buyers now in control.
Trendline Breakout: The price breaking above a key trendline further confirms a shift from a bearish or neutral market sentiment to a more bullish one. This is a strong signal that upward momentum is building.

TSLA: Low Is In , Rally IncomingTSLA is showing signs of strong accumulation, with buyers consistently stepping in and volume expanding on up-moves. Price structure is improving, breakouts further confirm strength, increasing the likelihood that bears have been left behind. Based on the price action and volume alone, TSLA looks ready for a potential sustained move higher.

DOGE Daily MA Hints and CluesDOGEUSD Daily Outlook: Signs of Accumulation?
Thanks for taking the time to check out my analysis on DOGEUSD. Let’s dive in.
Most traders are familiar with moving averages and crossover signals — and while these are often viewed as lagging indicators, I’ve found that using multiple moving averages together can offer much clearer insights, especially when paired with other supporting tools.
On this chart, I’m using a combination of simple moving averages (SMA) and exponential moving averages (EMA). I’ll break down the specific MAs I'm using in a follow-up post, but for now, I want to highlight what the moving average structure is showing us right now — and how it compares to similar price action in the past.
Take a look at the yellow arrows on the chart:
The arrow on the right marks the current price position relative to the moving averages.
The arrow on the left points to a similar setup from the past.
As the old saying goes: “History doesn’t repeat itself, but it often rhymes.”
The last time DOGEUSD price action sat in this zone, we saw about 45 to 50 days of consolidation and chop before the market broke into a strong parabolic move higher. Projecting that same timeframe forward puts us somewhere around mid-June.
While nothing is guaranteed in the markets, this chart suggests that accumulation around this zone could present a favorable risk-reward setup for a potential run in the near to mid-term.
My Approach:
I began accumulating a position today and plan to add on pullbacks if the opportunity presents itself.
As always, this is not financial advice — just sharing my personal outlook and strategy. Wishing you all success out there — stay patient, stay sharp.

Price breaking out of a wyckoff balance to go unbalanceMy approach the market was pointing out market had found a balance zone starting on April 9th- today. Today I notice high volume on the bull side towards one of the resistance points which it broke and retraced. One it started to retrace I went to the smaller time frame to look for a sniper entry( 5min bullish and strong delta candle stick rejecting of a low volume node and the session vwap ). The balance zone was $1450 wide so it should go imbalance for the same amount or close. This trade is really a 25rr but im going for 8rr to pass my 2nd phase in my challange. This trade will not hit instill like Wednesday maybe even to the end of next week.

