ACH/USDT at a Historical Pivot Zone — Is a Major Reversal🔍 In-Depth Weekly Chart Analysis of ACH/USDT
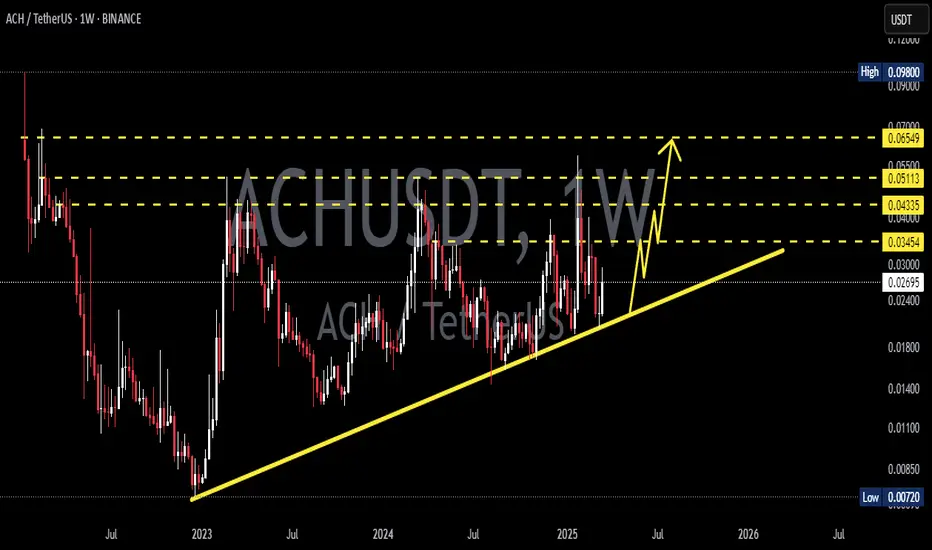
ACH/USDT is currently retesting a critical historical demand zone between $0.01876 – $0.02263, which has consistently acted as a major accumulation area since late 2022. This zone has served as the launchpad for multiple bullish moves in the past and is now being tested once again.
Interestingly, price action appears to be forming a long-term consolidation base, potentially a triple bottom pattern or a classic accumulation phase, which often precedes significant impulsive rallies.
✅ Bullish Scenario (High-Probability Reversal)
If price successfully:
1. Holds above $0.01876, and
2. Breaks above minor resistances at $0.02263 and $0.02867
Then a bullish reversal is likely, with price targeting the following resistance levels:
🔸 $0.02867 — structural resistance
🔸 $0.03441 — neckline zone of the accumulation pattern
🔸 $0.04075 — key psychological level
🔸 $0.05059 — full measured move target from the base pattern
Should momentum and market sentiment align, ACH could even test the $0.065–$0.098 range, especially if volume supports a breakout continuation.
Key confirmation: A weekly close above $0.02867 with strong volume would signal a clear breakout from accumulation.
❌ Bearish Scenario (Breakdown from Critical Support)
On the flip side, if price fails to hold:
A weekly breakdown and close below $0.01876 will invalidate the bullish structure.
This could lead to a decline toward:
$0.01400 — minor support
$0.01000 – $0.00720 — historical bottom zone
This would likely reflect a capitulation phase, particularly if accompanied by negative macro sentiment across the broader crypto market.
📈 Technical Pattern Structure
📌 Triple Bottom + Long-Term Accumulation = Early Reversal Signal
📌 Multiple rejections off the support zone = Buyer defense still strong
📌 Increasing volume near lows = Signs of smart money accumulation
📌 Formation of higher lows in the coming weeks will reinforce bullish momentum
💬 Market Psychology Insight
After prolonged sideways action, many retail traders tend to exit
This creates ideal conditions for smart money to accumulate quietly
A breakout from this zone could trigger mass FOMO, accelerating price action
🧠 Conclusion
ACH/USDT currently offers a highly attractive risk-to-reward setup, especially for swing traders and medium-term investors. The zone being tested is a make-or-break level that could dictate the next major trend. A confirmed breakout could mark the beginning of a powerful expansion phase.
#ACHUSDT #CryptoAnalysis #AltcoinReversal #BullishSetup #TechnicalAnalysis #TripleBottom #BreakoutTrade #SwingTradeOpportunity #CryptoOpportunities
Achusdtlong

#ACH/USDT#ACH
The price is moving within a descending channel on the 1-hour frame and is expected to break and continue upward.
We have a trend to stabilize above the 100 moving average once again.
We have a downtrend on the RSI indicator, which supports the upward move by breaking it upward.
We have a support area at the lower limit of the channel at 0.01800, acting as strong support from which the price can rebound.
Entry price: 0.01878
First target: 0.01925
Second target: 0.01970
Third target: 0.02025

ACHUSDT 1W AnalysisACH ~ 1W Analysis
#ACH This trade is very high risk. Buy from here if you still have confidence in this coin with a short term target of 20%+.

ACHUSDT 1WACH ~ 1W Analysis
#ACH This coin is still in a bullish trend. Buy when re -testing this support with a short -term target of at least 15%+.
#ACH/USDT#ACH
The price is moving in a descending channel on the 1-day frame and is sticking to it very well and is about to break upwards
We have a bounce from the lower limit of the channel at 0.01600
We have an uptrend on the RSI indicator that is about to break, which supports the rise
We have a trend to stabilize above the moving average 100
Entry price 0.2000
First target 0.02460
Second target 0.02800
Third target 0.03333

$ACH Poised for Bullish Reversal: Falling Wedge Setup!FWB:ACH (Alchemy Pay) is forming a falling wedge pattern on the 1D chart, which is typically a bullish reversal pattern.
📈 Entry Point: $0.0180 to $0.0190
🎯 Targets: $0.0250 $0.0300 $0.0400
🔄 Trading Options: FWB:ACH is available for trading on multiple exchanges. Consider setting a stop-loss at $0.0150 or if the price drops below the wedge support line.
📊 About FWB:ACH :
Alchemy Pay (ACH) is a leading payment solution provider, bridging the gap between fiat and crypto. With growing adoption and partnerships, it aims to make crypto payments seamless and accessible worldwide.
📢 DYOR, NFA
#Crypto

ACHUSDT Falling Wedge Pattern!ACHUSDT Technical analysis update
ACH has formed a falling wedge pattern on the daily chart, with the price moving towards the wedge's resistance line for a breakout. If the price breaks the wedge pattern, we can expect a strong move in ACH.
Buy Level: $0.0265
Stop Loss:$0.021
regards
Hexa

ACH/USDT - Alchemy Pay: TrendLine Breakout◳◱ On the $ACH/ CRYPTOCAP:USDT chart, the Trendline Breakout pattern suggests momentum building up for a significant move. Traders might observe resistance around 0.03917 | 0.04362 | 0.05482 and support near 0.02797 | 0.02122 | 0.01002. Entering trades at 0.03632 could be strategic, aiming for the next resistance level.
◰◲ General info :
▣ Name: Alchemy Pay
▣ Rank: 319
▣ Exchanges: Binance, Kucoin, Bybit, Huobipro, Gateio, Mexc
▣ Category/Sector: Financial - Payment Platforms
▣ Overview: Alchemy Pay is a payments solution platform that provides a gateway to connect the cryptocurrency and fiat economies. Not only does Alchemy Pay power the acceptance of cryptocurrencies through traditional payment protocols, but it also guarantees commercially viable settlement speeds by connecting with adaptation layers of blockchains and layer-2 networks.
◰◲ Technical Metrics :
▣ Mrkt Price: 0.03632 ₮
▣ 24HVol: 12,272,601.722 ₮
▣ 24H Chng: 5.245%
▣ 7-Days Chng: 31.86%
▣ 1-Month Chng: -0.53%
▣ 3-Months Chng: 120.74%
◲◰ Pivot Points - Levels :
◥ Resistance: 0.03917 | 0.04362 | 0.05482
◢ Support: 0.02797 | 0.02122 | 0.01002
◱◳ Indicators recommendation :
▣ Oscillators: NEUTRAL
▣ Moving Averages: STRONG_BUY
◰◲ Technical Indicators Summary : STRONG_BUY
◲◰ Sharpe Ratios :
▣ Last 30D: -0.01
▣ Last 90D: 2.66
▣ Last 1-Y: 0.49
▣ Last 3-Y: 0.99
◲◰ Volatility :
▣ Last 30D: 1.46
▣ Last 90D: 1.35
▣ Last 1-Y: 0.99
▣ Last 3-Y: 2.19
◳◰ Market Sentiment Index :
▣ News sentiment score is N/A
▣ Twitter sentiment score is 0.53 - Bullish
▣ Reddit sentiment score is 0.52 - Bullish
▣ In-depth ACHUSDT technical analysis on Tradingview TA page
▣ What do you think of this analysis? Share your insights and let's discuss in the comments below. Your like, follow and support would be greatly appreciated!
◲ Disclaimer
Please note that the information and publications provided are for informational purposes only and should not be construed as financial, investment, trading, or any other type of advice or recommendation. We encourage you to conduct your own research and consult with a qualified professional before making any financial decisions. The use of the information provided is solely at your own risk.
▣ Welcome to the home of charting big: TradingView
Benefit from a ton of financial analysis features, instruments and data. Have a look around, and if you do choose to go with an upgraded plan, you'll get up to $30.
Discover it here - affiliate link -

ACHUSD 1WACH ~ 1W 📈
#ACH Start making purchases gradually from here with a minimum target of 20%+.
‼️ This trade is high risk, it is best to Make purchases with smaller amounts ‼️

🚨#ACH/USDT Long#ACH
The price is moving in a descending channel on the 12-hour frame
We now have a successful penetration of that channel upward
We have oversold conditions on the MACD indicator
We return to continue the rise with the trend that was broken previously
Entry price is 0.01940
First goal 0.02010
Second goal 0.02180
Third goal 0.02340
Fourth goal: 0.02475

ACH On the way to pumpI see a good setup on ACH. Classic setup we have seen lot of times together, i expect a small dump, retest of trendline and pump.

Long trade setup for ACHUSDTFor the BINANCE:ACHUSDT.P Long Trade Setup, the following values are suitable for our interval trade:
Entry: 0.01813
Target: 0.01934
Stop: 0.01745
Cost Reduction: -
The profit is reasonable relative to the risk.
*This is not investment advice; you can lose money. Crypto AI Signals is not responsible for any trades. 🚫💰

ACHUSDT Double BottomACHUSDT Technical Analysis Update
Buy zone : Below $0.0167
Stop loss : $0.0155
Take Profit 1 : $0.0177
Take Profit 2 : $0.0205
Take Profit 3 : $0.0250
Always Keep Stop Loss

Alchemix (ACH) forming bullish Butterfly for upto 13.50% pumpHi dear friends, hope you are well and welcome to the new update on Alchemy Pay ACH with US Dollar pair.
Previously we caught nice trade of ACH as below:
Now on a 2-hr time frame, ACH is about to complete a bullish Butterfly move for the next price reversal.
Note: Above idea is for educational purpose only. It is advised to diversify and strictly follow the stop loss, and don't get stuck with trade.

ACH USDT LONG - DCA According to the trend line created in the time frame of 4 hours
The best opportunity to buy with the DCA method
In this scenario, the purchase is done in 3 steps
Due to the low probability of the third purchase, most capital has been invested in the first two purchases.
May blessings flow in your life :)

ACH preparing to make a move UP! (Long entry setup) A minor choch has happend and after validating it, I'm entering for a long position with the target of prior high!

ACH/USDT Technical Analysis (Request 20)The first 15 charts for the following alts have been posted on my other social platforms:-
Check the links in my bio.
1. LQTY ✅
2. SOL ✅
3. DOGE ✅
4. MASK ✅
5. OP ✅
6. DATA ✅
7. SAND ✅
8. MOVR ✅
9. FTM ✅
10. GALA ✅
11. GMT ✅
12. METIS ✅
13. COTI ✅
14. ROUTE✅
15. ALGO✅
Tradingview Charts:-
16. BEPRO ✅
17. LTC ✅
18. RUNE ✅
19.ROSE ✅
I will be covering 10 more charts from here.
DM me if you have any requests, and I will try to cover them.
Let's get back to the chart.
The best Entry for this setup is probably between $.032 to $.035
CMP is $.038.
DCA during the dips if you are looking to get into this one.
Likely to rally 100% + when the real alt Rally begins.
Let me know what you think and do hit the like button and share your view in the comment section.
Thank you
#PEACE

Alchemix (ALCX) formed bullish Gartley for another reversal moveHi dear friends, hope you are well and welcome to the new update on Alchemy Pay ACH with US Dollar pair.
On a 4-hr time frame, ACH is about to complete a bullish Gartley pattern.
Note: Above idea is for educational purpose only. It is advised to diversify and strictly follow the stop loss, and don't get stuck with trade

ACH and falling wedge HUOBI:ACHUSDT
Before we start to discuss, I would be glad if you share your opinion on this post's comment section and hit the like button if you enjoyed it.
Thank you.
Possible Targets
➡️Since May 2021 we are in global falling wedge.
➡️according by this global Fib we possible find a bottom at -0.38 lvl by FIB where you can add your limit orders
➡️Histogram also shows divergence on 1D timeframe and forming higher lows
➡️ On VPVR you can see the interest zones.
Hope you enjoyed the content I created, You can support with your likes and comments this idea so more people can watch!
Disclaimer: Please be aware of the risks involved in trading. This video was made for educational purposes only not for financial Investment Purposes.
Don't forget sub and join my channels under this idea!

ACHUSDT what's nextACHUSDT has moved exceptionally in last few days more than 30% now the price is at a critical level. Price action on current level will decide what's next for ACHUSDT
