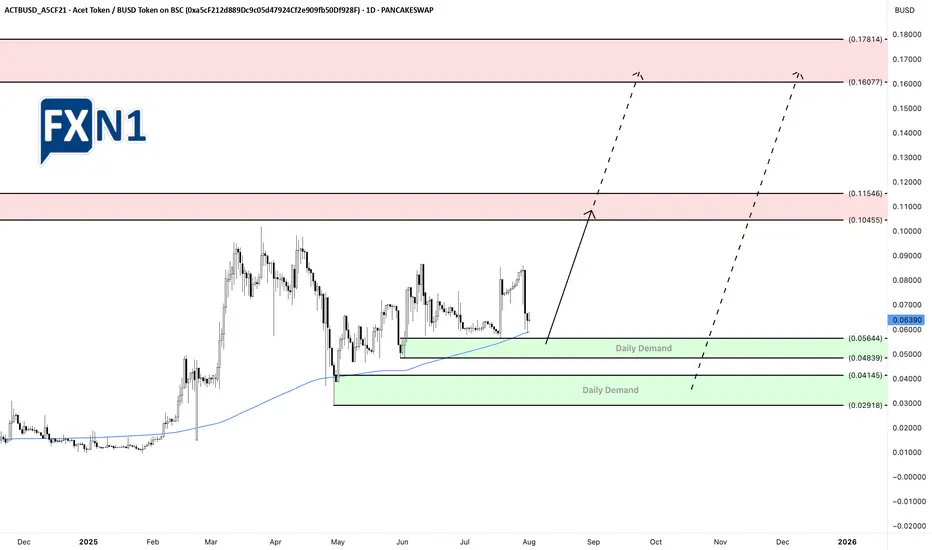
Acet Token’s Price Analysis: Levels and Future PotentialsThe Acet Token (ACT) is currently nearing a critical daily demand zone at 0.05644, suggesting a potential opportunity for a bullish move or a strategic entry at a discounted rate. Additionally, there is another fresh daily demand level at 0.04145, which could present an even more attractive entry point for those willing to buy at a lower price. Looking ahead, the token might retest higher levels around 0.10445, which stands as our primary target for future gains.
Acet (ACT) stands out in the crowded cryptocurrency field by pioneering the "Initial Zero Supply" model, aimed at tackling issues related to token oversupply. Developed by Thai trader and entrepreneur Acme Worawat, Acet is more than just a digital asset—it represents a movement towards integrating cryptocurrencies into larger economic systems. Built on Binance Smart Chain (BSC) and compliant with the BEP-20 standard, Acet employs a Zero Initial Supply strategy, where tokens are generated through Liquidity Mining. This process involves users staking assets in designated pools, with smart contracts ensuring transparent, secure, and efficient token issuance.
✅ Please share your thoughts about ACT in the comments section below and HIT LIKE if you appreciate my analysis. Don't forget to FOLLOW ME; you will help us a lot with this small contribution.
Act
ACT TOKEN - Price can fall to support area and then bounce upHi guys, this is my overview for ACTBUSD, feel free to check it and write your feedback in comments👊
The price was trading within a descending channel for a considerable period.
The asset consistently found support at the lower boundary of this formation, within the 0.0590 - 0.0570 price zone.
Recently, a strong upward impulse allowed the price to break out from the upper boundary of the channel.
Following the breakout, the price executed a corrective move back to the broken resistance line, successfully retesting the 0.0730 - 0.0750 area.
This zone is now acting as a new support level, and the price has begun to move upwards from it, showing renewed buyer strength.
I expect that the asset will continue its growth from this support. My first target is set at the 0.0860 level, with the second target at 0.0970 points.
If this post is useful to you, you can support me with like/boost and advice in comments❤️

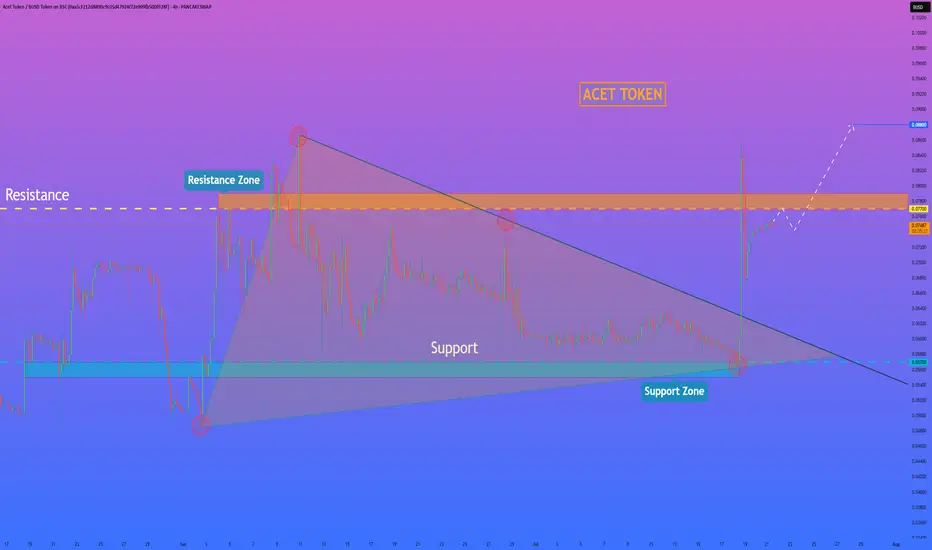
HelenP. I Acet Token may make correction and then continue growHi folks today I'm prepared for you Act Token analytics. If we look at the chart, we can observe a clear technical picture. For a considerable amount of time, the price was tightly compressed inside a large downward wedge, defined by a robust support zone at 0.0570 - 0.0550 and a descending trend line that put consistent pressure on the price. Such long consolidation periods often precede a powerful expansion. Recently, we have witnessed a decisive breakout from this wedge, confirmed by a strong impulse candle. This move signals a clear shift in market sentiment from neutral to bullish and invalidates the prior constraining structure. I believe that the momentum from this breakout will be sufficient to challenge the next major obstacle: the horizontal resistance zone at 0.0770 - 0.0790. This is a critical level to watch, as it has previously rejected price advances. My scenario implies that after potentially a small, healthy correction or retest, the price will continue its upward movement. A successful break above this critical area would confirm the newfound strength of the buyers and open up a clear path for further appreciation. For this reason, my primary goal, the logical target for this move, is set at the 0.0880 level. If you like my analytics you may support me with your like/comment ❤️
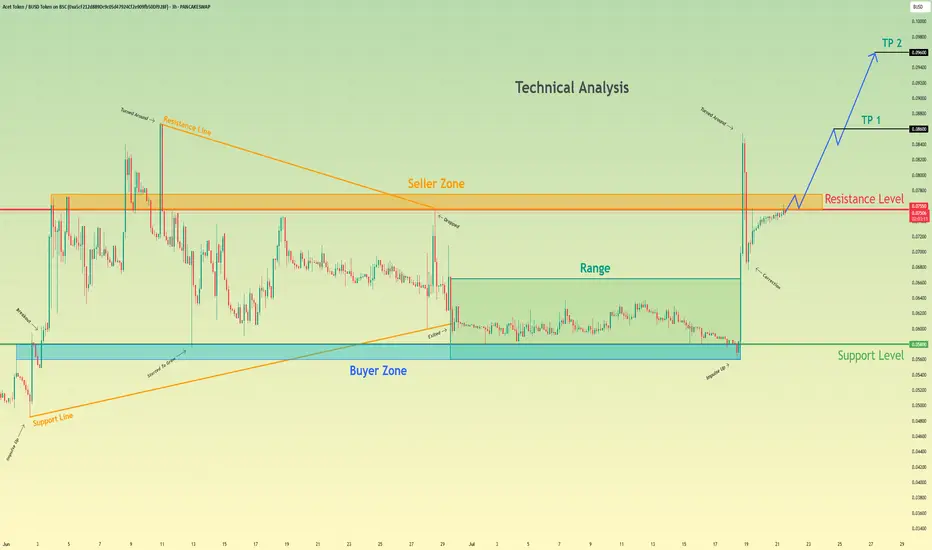
Acet Token will break resistance level and continue to move upHello traders, I want share with you my opinion about Acet Token. Looking at the recent price action, we can see a clear narrative unfolding. The asset initially formed a large wedge pattern, experiencing a trend reversal that led to a breakdown and a period of prolonged consolidation within a defined range between the buyer zone around 0.0580 and the upper boundary. Recently, however, the market showed a strong impulse, breaking out of this range and decisively moving upwards. Currently, the price of act is testing the key resistance level at 0.0755, an area historically defined as a seller zone. The hypothesis is that after this powerful impulse, the asset will manage to break and hold above this resistance. A successful retest of the 0.0755 level would likely signal a continuation of the uptrend, paving the way towards our specified take-profit targets. The first goal is set at TP 1 at 0.0860, with a further extension to TP 2 at 0.0960, capitalizing on the anticipated bullish momentum. Please share this idea with your friends and click Boost 🚀
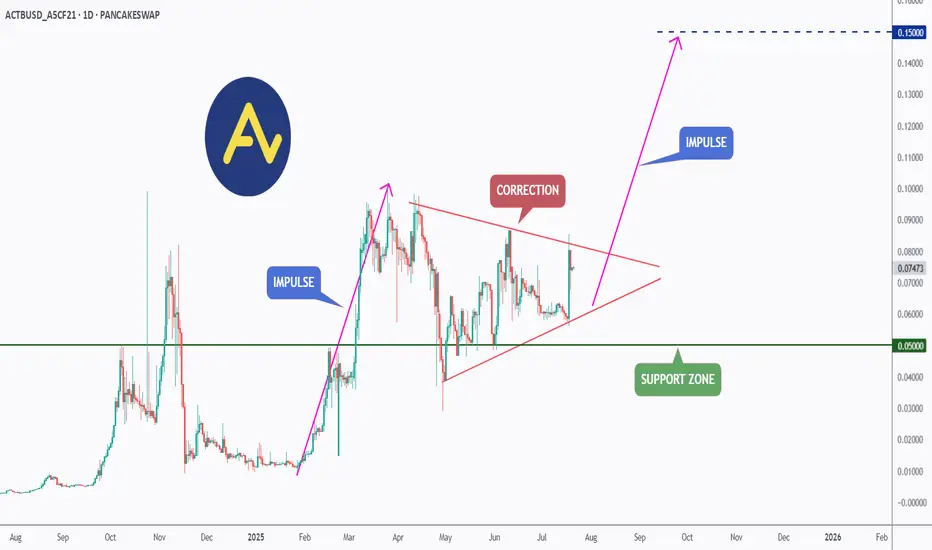
ACT (Acet) - Eyeing the Next Impulse Move?ACT has been forming a textbook bullish continuation pattern.↗️
After a strong impulse leg earlier this year, price has been consolidating within a symmetrical triangle, signaling a healthy correction phase.
🏹Today, ACT broke out of the triangle to the upside , indicating that bulls may be taking control once again.
📍If momentum continues, the next impulse move could push price toward the $0.15 resistance as a first target — a major psychological and technical level.
As long as the $0.050 support holds, ACT remains in bullish territory with upside potential in sight.
📚 Always follow your trading plan regarding entry, risk management, and trade management.
Good luck!
All Strategies Are Good; If Managed Properly!
~Richard Nasr
ACTUSDT Forming Classic Falling Wedge ACTUSDT is currently exhibiting a classic falling wedge pattern on the chart—a bullish reversal setup known for its high probability of a breakout to the upside. After a consistent downtrend, the price action has started to compress within converging trendlines, suggesting that selling pressure is diminishing. A breakout above the wedge's resistance line could trigger a sharp price surge. Technical traders often look to such formations for potential entries, especially when combined with growing volume and renewed market sentiment.
Volume analysis reveals a notable uptick in recent sessions, signaling that investors are beginning to accumulate ACTUSDT. This increased interest could be due to fundamental news or broader market momentum returning to altcoins. When volume expands near the apex of a falling wedge, it usually reinforces the validity of the pattern and strengthens the breakout potential. With this setup, the projected move points to a possible gain of 140% to 150%, aligning with previous key resistance levels that the price could retest post-breakout.
On a momentum front, indicators like RSI and MACD are starting to turn bullish, offering early signs of a reversal. The price is also holding above short-term support zones, suggesting the formation of a base. The combination of technical structure, volume dynamics, and improving sentiment makes ACTUSDT a strong contender for a breakout move in the near term. Such opportunities are especially attractive in trending markets where capital rotates quickly into coins showing strong chart setups.
Given this confluence of bullish signals, ACTUSDT could become a leading performer in the altcoin space over the coming weeks. Traders and investors are advised to keep a close watch for breakout confirmation and subsequent retest levels, which could offer optimal entry points for both short-term gains and medium-term swing setups.
✅ Show your support by hitting the like button and
✅ Leaving a comment below! (What is You opinion about this Coin)
Your feedback and engagement keep me inspired to share more insightful market analysis with you!

Continuation of the PORTO trendAccording to porto, the picture resembles alpine, the goal is also to try to take the level of 1.5 with the opening of the second half of the quarter higher, which will create the ground for a stable trend immediately to 2.5. The main medium-term goal is the range of 2.5-3.5, where large volumes of purchases were previously left. I would like to note that the level of 2.5 is the threshold for the growth of volatility, and in case of its breakdown, any growth wave can give an impulse up to 5 and 7.5. If there is insufficient volatility, there is a possibility of a rollback to a 0.9-1.0 retest and a second attempt to take 1.5 by the beginning of the new month.
Porto Lazio adm city acm does not have futures on finance yet and may be added in the near future, which will cause a wave of growth up to 100%+ for these tokens. Together with this group, I am considering alpine for work, while the rest of the fan tokens are still in a more overbought zone.

A likely move by ALPINEToday, the market looks very optimistic. The week on air opened above 2500, which compensates for sales on a weekly schedule. You can continue to keep working on fantokens to maintain growth in a row. In the absence of a significant market drawdown, an additional wave of purchases of up to 70-100% from current levels is likely. Binance also continues to support this group of instruments by adding futures. There is a possibility of a new announcement regarding atm city acm tomorrow.
To date, the fan token group remains the most undervalued instruments on binance. In addition to ATM AND ACM, which are the most oversold among them, I am considering the work of ALPINE in connection with the recent addition of futures on binance and listings on several small exchanges. These factors can contribute to significant liquidity inflows and growth. A technical signal was also left for a breakdown of the strong resistance of 1.5, which will open the way immediately to 2.5. In an optimistic scenario, an attempt to open above 1.5 in the second half of the quarter can be expected in the next few days, which will pave the way for purchases until the end of the half-year. In a more negative scenario and a drawdown of ether below 1400-1500, there is a possibility of a slight pullback and an attempt to consolidate above 1.5 for ALPINE already in the last days of the month in order to open a new monthly candle above this level. This rollback will provide an additional opportunity to top up the position and make a profit. I would like to draw your attention to the fact that the main level for increasing volatility is 2.5, in case of a breakdown of which there is a possibility of a growth impulse to 5.0 and 7.5.

On the zero line of the borderACTUSDT – Daily Technical Analysis
After experiencing a 74% correction, ACT has reached a major support level at $0.0480 , where the price has currently stabilized. From this zone, there is a potential upside move of 26%, targeting the resistance at $0.0650.
However, traders should closely monitor the support level, as a confirmed breakdown below $0.0480 could trigger a bearish flag continuation pattern, potentially leading to another 74% drop.
🟢 Support: $0.0480 (major level)
🔴 Resistance: $0.0650 (26% above current price)
⚠️ Risk: Breakdown could activate a bearish flag and resume the downtrend

ACT: Classic Range Accumulation with Breakout Potential#ACT is showing clean sideways movement with classic deviations—textbook accumulation. Horizontal volume is stacked right in the middle, confirming the range is solid.
This one’s coiling up for a move. Follow me so you’re in before it breaks out. 🚀
Entry: 0.052-0.0536
TP: 0.068
SL: 0.0463

BTC is still bullish!!!🚨 CRYPTOCAP:BTC is dipping hard! 🚨
📍 All eyes on $72,000 — this could be the ultimate buy zone:
🔽 Why this level matters:
1️⃣ Bottom of the blue wedge
2️⃣ Flipped resistance → support
3️⃣ Major demand zone
4️⃣ Classic -34% pullback move
📊 This could be a textbook entry point.
Are you ready to catch the bounce?

Public trade #5 - #ACT price analysis ( Act I: The AI Prophec )Nowadays, the #ACT coin is quite hype.
And most platforms display the OKX:ACTUSDT chart as circled above.
What do you think of this full price chart of #ACTUSDT presented by us?)
Scary, isn't it?)
👀 We are going to watch this asset for now #ActITheAIProphecy
And we would dare to buy not earlier than if the price falls into the Buy zone $0.024 - $0.036 - $0.048
_____________________
Did you like our analysis? Leave a comment, like, and follow to get more

The AI Prophecy: Marketwide Bullishness ProofThis is a chart and pair that I showed you recently. Why am I showing it to you again?
This is the proof.
The Altcoins market is bullish and the Altcoins market can only be bullish when Bitcoin is either growing or set to grow.
Notice the last five days, how did Bitcoin perform?
When Bitcoin crashes, everything crashes but, look at this divergence between Bitcoin and many Altcoins.
Look at the last five days for ACTUSDT, or many others, and what do you see?
➖ This pair remains strong and trading above EMA13.
➖ This pair is super-bullish, above a consolidation pattern and ready to grow.
➖ This pair broke out of a downtrend is now ready to move up.
This and other Altcoins cannot grow while Bitcoin goes down toward 40K, that's not how Bitcoin/Crypto works.
The market grows when Bitcoin grows.
What this chart reveals is a hidden bullish bias, the bottom is already in. We are going up now.
Hold patiently. Feel secure and feel safe because Cryptocurrency is set to grow like never before.
Thanks a lot for your continued support.
Namaste.

ACTUSDT 1WACT ~ 1W Analysis
#ACT Buy after successfully penetrating this resistance line, with a short -term target of at least 15%+.
Reason, The seller's pressure seems to have been completed.

$ACT ANALYSIS!NASDAQ:ACT is testing the black resistance line ⚫.
✅ If breakout is successful, the first target is the green line level 🟩.

ACT ANALYSIS (4H)ACT is in a major correction. This correction is a large-degree diametric. It now appears to have entered the bearish G wave.
The price is pulling back into zones where sell orders exist to complete wave G.
A daily candle closing above the invalidation level will invalidate this analysis.
For risk management, please don't forget stop loss and capital management
Comment if you have any questions
Thank You

ACT Coin NEXT POSSIBLE MOVES AND TRADE SETUPS !!NASDAQ:ACT Coin Update & Next Possible Moves!!
• Right now NASDAQ:ACT Coin price trading in a falling wedge on 1D Tf & overall structure look bearish.
• but once its break its resistance trendline then minimum 30% bounce back expected.
• Let's see what happened.
Warning : That's just my analysis DYOR Before taking ant action🚨

Trading opportunity for ACTUSDTBased on technical factors there is a Sell position in :
📊 ACTUSDT
🔴 Sell Now
🪫Stop loss 0.238000
🔋Target 0.114000
📏 R/R 2
💸RISK : 1%
We hope it is profitable for you ❤️
Please support our activity with your likes👍 and comments📝

$ACT - Long SetupAltcoins have been down so bad from their highs, but I'm still expecting high volatility this week.
Just taking this one with a tight stoploss just below 0.15 (low)
Long at current market price (cmp) , dca level at 0.165
Targets:
tp1 - 0.20
tp2 - 0.25
tp3 - 0.32

Trading opportunity for ACTUSDTBased on technical factors there is a Buy position in :
📊 ACTUSDT
🔵 Buy Now
🪫Stop loss 0.243000
🔋Target 0.287000
📏 R/R 2
💸RISK : 1%
We hope it is profitable for you ❤️
Please support our activity with your likes👍 and comments📝

ACT - LONG - Good opportunityACT is now ready to give us a chance. Despite being a little late it is still in a good place for daily timeframe. This is a moderate risk trade, as we have a small confirmation and good support. These currencies are also very volatile and high leverage should not be used.
TP 1: 0.42
TP 2: 0.58
TP 3: 0.63 (It's not very likely, but it could be).
SL 1: 0.2368
SL 2: 0.21
-
First trade of 2025, have a happy new year.

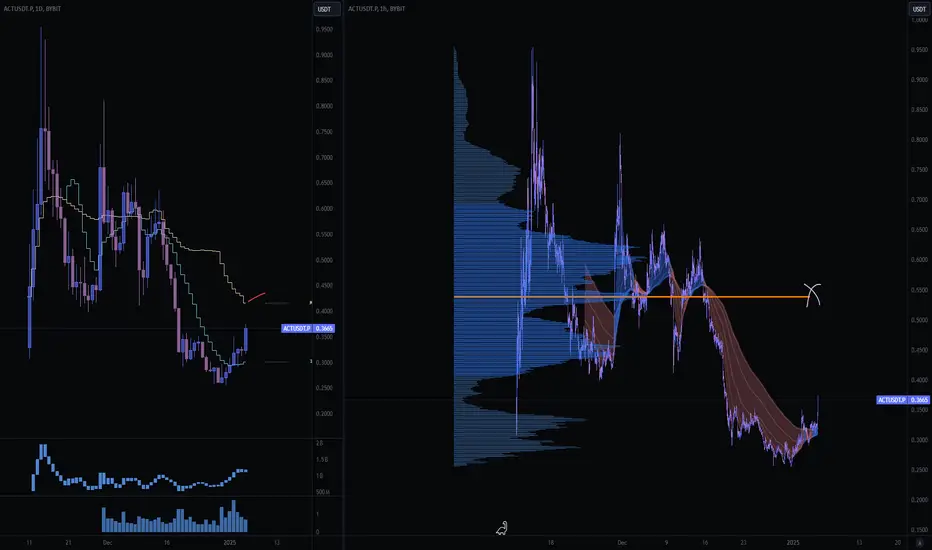
ACTUSDT (ACT I) Updated till 05-01-25ACTUSDT (ACT I) Daily timeframe range. PA is fairly new here if it can stay above 0.2530 it got huge chances of good trades. there is fundamental support too. for now if PA can break 0.4169 clean than it can push toward 0.6714 or above.

$ACT - Scalp Long SetupACT is showing signs of recovery and gaining traction, suggesting it might be ready for another upward move.
ACT has shown signs of potential growth, having deviated slightly on its previous low at .40
If we can hold .35 support, we can potentially retest this previous low.
Long Entry: at cmp .36 to .34
Stop below .30
Potential Long targets:
.40-.42 (m_evwap)
.50-.54 (npoc/hvn)
.60-.64 (w_vwap)