s&p500 e-mini futures - a price action - market updateAs long as this does not have a bear close below the 15m 20ema, it's a buy and only buy. Bears might soon step aside and we pop up big again.
Action

dax - a weekly priceaction recap and outlookGood evening and welcome to the 2024 early bull games. Something like that bears must have felt thursday and friday. S&P500 & Nasdaq futures are breaking out big time and are on their way printing new all time highs. That being said i still think the moves are part of their respective monthly trading ranges and we won’t trade far above.
dax cfd
Dax was early with the consecutive new ath’s and is now lagging a bit behind the bullish price action on us indices. So the biggest question into next week is, will we break above the smaller bear channel and join the us rally or are dax bulls done and every rip get’s sold?
We had 3 legs down inside the bear channel, broke out of the triangle to the downside but bulls closed at the friday highs and above the daily 20ema. For me to complete this market cycle (trading range after the big rally from october), would be another touch of the upper bear channel. Which one? Doesn’t matter but i think the higher one around 16970ish will get touched or broken. Why?
Let’s talk bull case first: Bears could not produce lower prices or big consecutive bear days below the 20ema. Bear channel held and bulls just bough everything under 16700. Bears tried 3 times and now they will probably give up to short higher again. Thursday and friday printed consecutive bull bars and it’s a buy signal. They want a retest of the ath or at least trade back to upper channel lines.
Bear case: The ath at 17199.5 was done with a big gap up and the daily closed deeply red. Since then every attemp at 17000 was rejected. Not really surprising after printing multiple new ath’s in the last weeks. Bears see the the break below the triangle as confirmation for lower prices and thursday + friday as a retest of that breakout. They do not want the market to close above the smaller bear channel line around 16800 otherwise bulls will see this as a buy signal.
outlook last week: sideways - good outlook since we closed a bit below last week
short term: probably up but just slighty in my odds. if friday was a bull trap and bears can get strong selling pressure, i look for shorts. but i would also not be surprised if we close monday above 17000.
medium-long term: down - what would change that? two consecutive daily closes above 17300

2024-01-18 - a daily price action after hour update - nasdaq
Good evening and i hope you had a good trading day. Bulls took over in the globex session and we never looked back. Yesterday i said in my short term outlook that we go up and we did.
nasdaq e-mini futures
Most bullish indix of em all. Many of the same as dax for today. Nq just reached higher prices. We are trading 38 points below the december high and i think we will get there. Can we touch the big upper wedge? Probably. Bull case is the 400 point rally from the weekly low yesterday which could easily go to the wedge line around 17250. Bulls even bought the 160 point dip midday to close at the highs. Bear case is that this is a trading range from 16950 to 17120. The selloff from bar 43 to 50 was deep enough to dampen the euphoric rally. We are also at the highs of the wedge on the daily tf. They also argue that this is a trading range inside a bigger one between 16450 to 17130. So the question is, how much more room is there for the bulls despite the selling pressure? I think the most reasonable case is, that above 17100 there were many trapped bulls from the december high who will gladly use this rally to exit out of their longs and that’s another reason why i think the upside is limited. But i also thought NVIDIA at 400$ was high enough, so bulls might just continue to dance until the music stops.
short term: sideways to down (weakly held and i will long on big bull bars)
medium-long term: big down
New swing short position opened for nasdaq. I think shorting above 17000 on higher timeframes is a no brainer.

2024-01-18 - dax price action update
Good Morning,
i could see dax breaking out of this bull channel to rally upwards. I'd look only for longs here. Here is my recap from yesterday after hours to give more context:
Let’s look at the 1h tf because today closed 10 points above the opening price. That tell’s you enough. Opex sold off 100 points to eu open and bulls could not get this above 16560. Bears tried multiple times to push this below 16500 but every attempt was bought. One side tries to push the market into a direction just so many times before they give up. This brings us to an adjusted big lower bear channel line so market is free to move up imo. We will trade sideways to up in the globex session which would bring the 1h 20ema closer or we can get above it. More reasons why we market could go up. Bar 10 + 16 today formed a double bottom and bar 16 + 19 could already have set the new bull channel upwards. If you look at the daily chart, you can clearly see 3 pushes down and an expanding triangle. Lows from 2023-12-18 + 2024-01-05 + 2024-01-17. Do i have a short term bear case? Not really, i think the odds that we break below that channel and close low are below 25%.
short term: up
medium-long term: down

2024-01-17 - a daily price action after hour update - nasdaq
Good evening and i hope you are well. We continue the big downs and big ups. Both sides can make money yet bears manage to make lower lows and lower highs.
nasdaq e-mini futures
Tricky. Bears making new lows but bulls buying it all and closing at the highs. Yet they did not manage to trade above yesterdays open and the globex high. I do think the move from 16689 up was strong enough to get a measured move to around 17000 but bulls first target tomorrow is 1h close above 16900. We clearly broke above of the triangle and the tight new bull channel could get us above 16900. Bears see it as a two legged move inside a broad bear channel. They will try to keep it under 16900 and close the week below 16700 or maybe even touch the lower bull wedge line from early december + early january at around 16600. That beeing said. Bears still can not close below the daily 20ema which is bullish. Bulls want a retest of the december high at 17165 and keep the big bull wedge alive.
short term: sideways but can break out both ways again. we currently go up and down almost every day
medium-long term: down

2024-01-17 sp500 e-mini futures update
best guess is the red channel could hold for bears. got a dip below and now we test the top to make a lower high. it's a weak bull channel upwards. target is also around the daily 20ema. big sell off into close would be nice.

2024-01-16 - a daily price action after hour update - sp500Good Morning,
sp500 is currently selling off during globex before the EU session but we are right at multiple support levels and the daily 20ema. If bulls can hold it above 4770, odds favor continuation of the trading range and we might go up to at least 4800 again. If bears can push this below, next target would be 4750 for me. There market has a chance to form a inv SHS or go straight to last weeks lows at 4700.

Wipro Simple Price Action Trend Analysis BullishIn the past NSE:WIPRO was in a Down Trend, thereafter a Descending Channel formed in this chart which is a Bullish Pattern.
Recently price was able to create a HH in this chart which is also a signal for the beginning of a New Uptrend.
And the price is currently reacting from a Trap Zone, this should ideally take the price up.
The First Target is 452 and Second Target would be approx. 523

Tech Mahindra Simple Analysis BullishNSE:TECHM This stock has fallen a lot in the past and today broke an Important Resistance of a Consolidation.
Not only that, it also created a Trap Zone on the way. This stock should go up and give us a minimum of 10 to 15% Return on Investment in quick succession.

Bitcoin 2023 nding WaysAs of now, Bitcoin is priced at $42,815, accompanied by a 24-hour trading volume of $24 billion. Its market capitalization stands at $843 billion, commanding 54% of the market share. In the past 24 hours, BTC has encountered a 0.96% decrease in price. With a circulating supply of 19.46 million BTC out of a maximum possible supply of 21 million BTC.
Bitcoin's recent attempt to breach the $44,000 resistance faced selling pressure, triggering a decline in its value. Currently, resistance is noted at $44,982, while support for BTC/USD is established at $41,784. The analysis for December 26 indicates that bears have initiated a robust selling pressure, eroding buyer confidence around the $44,000 mark. Consequently, BTC is experiencing a significant decline, setting the stage for a downward correction.
Examining the 1-day chart reveals a diminishing buying demand for Bitcoin as it grapples with this decline in value. Bio for more..................

RAILTELBUY ABV - 120
TARGET - 140
Its forming double bottom and Training too.
Lets watch and trade.
*Candle close is important

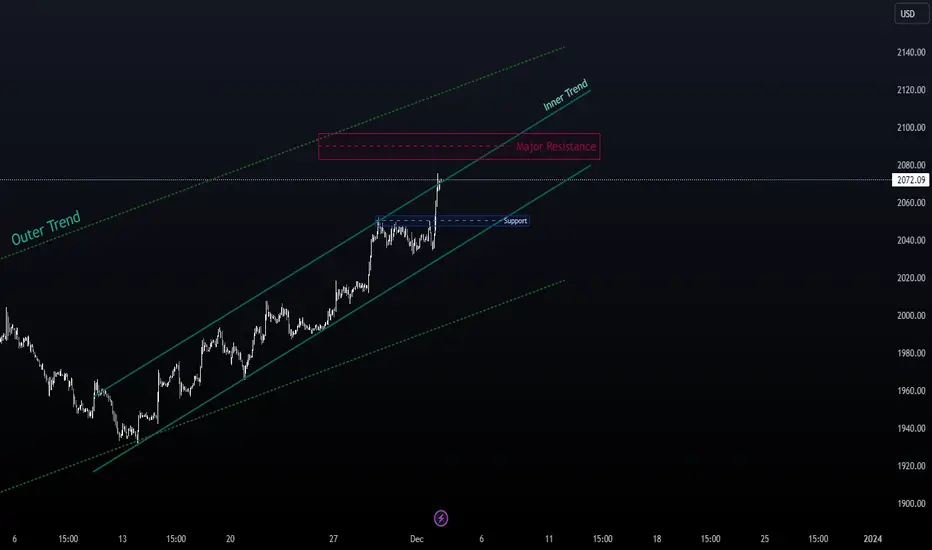
Gold xauusd Price Action AnalysesAsalam e kum everyone here is gold price Action analyses.
if you can see gold is in Buying Trend and now it close on major Risistance so posible setuation are gold will reject from there so now we need to think about sells bcs gold is our bought
Axis Bank Simple Price Action Analysis BullishNSE:AXISBANK is in an Uptrend making continuous HHs and HLs in the Candlestick Chart.
With these HH and HL, the price has created two Bullish Patterns in this Chart: A Cup and Handle Pattern which is a Continuation Pattern, and a Right-Angled Descending Broadening Triangle.
We also have a few Trap Zones in this chart; hence my expectation is that the Price of Axis Bank should go up and make another HH.
Looking at a Target of 164 that is approx. 12% Return on Investment.

Heromotoco Simple Price action Analysis BullishNSE:HEROMOTOCO was in Down Trend in the past and now it has started creating HHs and HLs in the candlestick chart, this is a signal of an ongoing Up-Trend.
As long as the last HL is holding price should go up and make a new HH in this chart. I have used the Channel tool to find out the right Target for now.
The expectation is Price will go up to 3400 i.e., an approximate 11% Return on Investment in quick succession.

Bajaj-Auto Simple Price Action Analysis BullishNSE:BAJAJ_AUTO is in an Up-Trend and it is continuously creating Higher Highs and Higher Lows on the Candlestick Chart.
As there is no Trend Change signal, hence the expectation is that it will continue its Up-Trend by creating a new Higher Low in this Chart.
Price can test the Trendline and the last Resistance before going up.
So, we should think of Buying this Stock at every Dip and holding it till 5599. This will give a Return on Investment between 20% to 29% in just a few days.

expect an accumulation in the zone of 12000 10000 after a heavy drop, i see Bitcoin stopping on 10000, there is there many aspect of price action (ranges analysis, volume) that make it a interesting area to expect a stoppage, and à rise as a pullback or the beginning of a new heavy uptrend

40 MES Getting ShortI'm looking for ever opportunity to be short in this market after a large run up last week. Taking this newly created breaklevel at 4370. Hoping it respects that breaklevel and continues downward. Putting my stop at the next breaklevel above at 4374.

I would enter these kind of trades any dayHere is my chart on the long term using price action on the daily chart as my cue.
These trades are long dated, but the risk to reward is quite massive.
From what I see, it likes to target liquidity and raid those stop losses. Currently, I am looking at a short entry with a limited stop loss to target lower recent lows. There are quite a bit of trades you can get with different targets.
It took a little refining of my old charts and more focused on a longer time perspective rather than trading the bounces in between.

Adaniports Simple Price Action AnalysisNSE:ADANIPORTS Bad News vs. a Trap Level.
This stock is continuously making HH and HL in the chart and currently hovering inside a Trap Zone.
The expectation is it will go up to 892.85/-, which will make this Trade a Reward to Risk of 2.5:1 and approx 10.56% Return on Investment from the Current Market price (807.55).
Disclaimer: Stock trading is inherently risky and you agree to assume complete and full responsibility for the outcomes of all trading decisions that you make, including but not limited to loss of capital or even provision of additional margin in futures trading. None of the stock trading calls made by Prosenjit should be construed as an offer to buy or sell securities, nor advice to do so. All comments and posts made by Prosenjit, and employees are for information purposes only and under no circumstances should be used for actual trading.

I expect a decline for EURUSDI have a long target for EURUSD. I have high expectations for this process, which will take a little longer. I will support this transaction, which I bought with a risk of 1.5%, with lot increases from time to time.

A Final Confirmation For GoldWhen the trend breakout I was waiting for happens, I expect my target to hold until December 24.

Bitcoin Update - Will the Decline Come?I'm waiting for a setup I find to make its final move. If, as I have drawn, he goes out of the channel and re-enters, the goal will proceed as I have set. I'm on the lookout and I'm going to try a short short trade with 50% leverage.

Bitcoin Decline Depends on HourlyCandleIf the open candle does not close as bullish, the target is $30,370
I think I have seen the first harbinger of this sudden rise, the decline of which I have been waiting for a while. If this candle closes like this, I think it will go down a bit.
