Cardano (ADA) - September 16Hello?
Welcome, traders.
By "following", you can always get new information quickly.
Please also click "Like".
Have a nice day.
-------------------------------------
(ADAUSD 1W Chart)
If the price holds above the 0.918 point, it is expected that the uptrend will continue.
In particular, if the price holds above the 1.316 point, it is expected to create a new wave.
(1D chart)
Section A is the old new high section.
At this point, what choices did you make?
And, what kind of decisions have you made in section B now...
Where can you sell to make a profit and where can you buy to make a profit is the question everyone is curious about.
I also think a lot about how to buy at a low price and sell at a high price.
To address this to some extent, I am profiting from marking points of support and resistance and reacting according to the criteria I set.
The section that formed a high in section A and was supported by falling is the section 0.918-1.130.
In particular, the surge came as it broke above the 1.547 point.
Therefore, if the decline is in the B section, it is highly likely to find support in the 0.918-1.547 section.
If the price can hold in the 2.486-2.647 range, the uptrend will continue.
If it does go down, it could drop near the 2.005 point, so you need to be careful with your trades.
If you've looked at my charts often, you'll see lines like the Fibonacci Retracement Ratio on most charts.
The section with two consecutive lines determines the trend, and expresses the section where support and resistance play a strong role.
Thus, the 2.486-2.647 zone will form a support and resistance zone.
If you look at the overall picture, the section 1.524-2.486 is a large crosswalk section.
The sidewalk section is divided into an upper sidewalk section and a lower circular section at the 2.005 point.
If the price is maintained in the 2.005-2.486 section, which is the upper sideways section, it can be judged that there is room for an uptrend.
However, I don't think it's a good idea to make a new investment as there is a strong support and resistance zone right above it.
If it falls to the 1.524-2.005 section, which is the lower sideways section, people will feel fear.
However, if the price is maintained, it can rise with a larger increase, so if you have confirmed the support, it is a section where you should proceed with a split purchase.
ADA, along with ETH, is one of the coins that has a successful staking service.
Therefore, it is a coin with a high possibility of continuing to rise in the medium to long term.
-------------------------------------
(ADABTC 1W chart)
If the price is maintained above the 1593 satoshi-1944 satoshi range, it is expected that the upward trend will continue.
In particular, if the price is maintained over the volume profile section spanning the 2147 Satoshi-2982 Satoshi section, it is expected to create a new wave.
I think the 3953 Satoshi point or higher is the high point section.
Therefore, careful trading is required because it is considered to be the domain of those who hold rather than new investments in the highs.
(1D chart)
We need to see if we can sustain the price by finding support at the critical 5049 satoshi point and moving above the 5354 satoshi point.
If it goes down, we should see if there is support in the 4412 satoshi-4675 satoshi section.
If it falls from the 4412 Satoshi point, it can touch the 3251 Satoshi-3607 Satoshi section, so a short-term Stop Loss is required.
If the price holds above the 4675 satoshi point, I expect it to move up to the 5743 satoshi-6099 satoshi section and re-determine the trend.
------------------------------------------
We recommend that you trade with your average unit price.
This is because, if the price is below your average unit price, whether it is in an uptrend or in a downtrend, there is a high possibility that you will not be able to get a big profit due to the psychological burden.
The center of all trading starts with the average unit price at which you start trading.
If you ignore this, you may be trading in the wrong direction.
Therefore, it is important to find a way to lower the average unit price and adjust the proportion of the investment, ultimately allowing the funds corresponding to the profits to regenerate themselves.
------------------------------------------------------------ -----------------------------------------------------
** All indicators are lagging indicators.
Therefore, it is important to be aware that the indicator moves accordingly as price and volume move.
However, for the sake of convenience, we are talking in reverse for the interpretation of the indicator.
** The MRHAB-O and MRHAB-B indicators used in the chart are indicators of our channel that have not been released yet.
(Since it was not disclosed, you can use this chart without any restrictions by sharing this chart and copying and pasting the indicators.)
** The wRSI_SR indicator is an indicator created by adding settings and options to the existing Stochastic RSI indicator.
Therefore, the interpretation is the same as the traditional Stochastic RSI indicator. (K, D line -> R, S line)
** The OBV indicator was re-created by applying a formula to the DepthHouse Trading indicator, an indicator disclosed by oh92. (Thanks for this.)
** Support or resistance is based on the closing price of the 1D chart.
** All descriptions are for reference only and do not guarantee a profit or loss in investment.
(Short-term Stop Loss can be said to be a point where profit and loss can be preserved or additional entry can be made through split trading. It is a short-term investment perspective.)
ADABTC

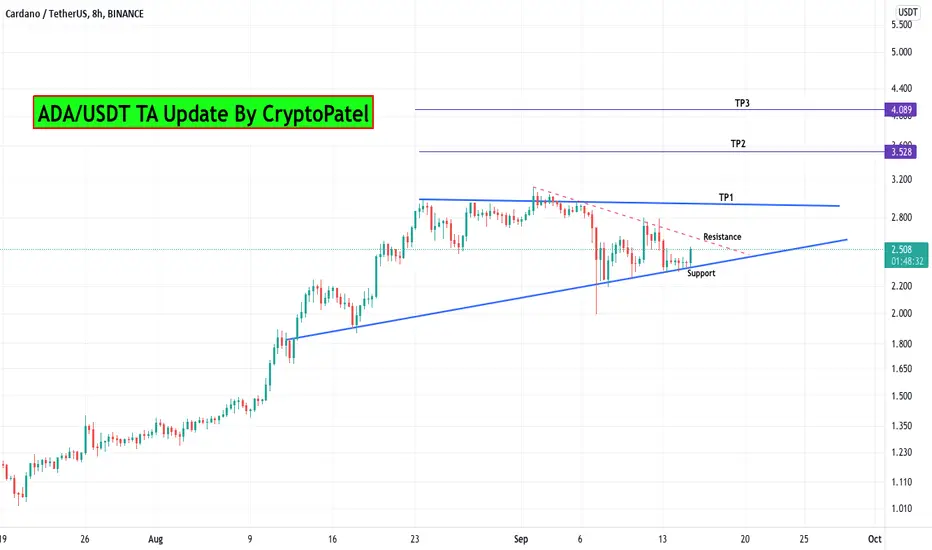
ADA/USDT TA Update and Potential 100% from here#ADA/USDT TA Update:-
$ADA currently trading around $2.5
And bounced from Support level.
Entry:- $2.40-$2.50
Targets:- $2.93/$3.52/$4.08
Stop Loss:- $2.30
Support:- $2.37
Resistance:- $2.60/$2.93
ADAADA looks to be almost finished with a brutal W4 correction and should start heading towards $3.40 into Oct IMO.

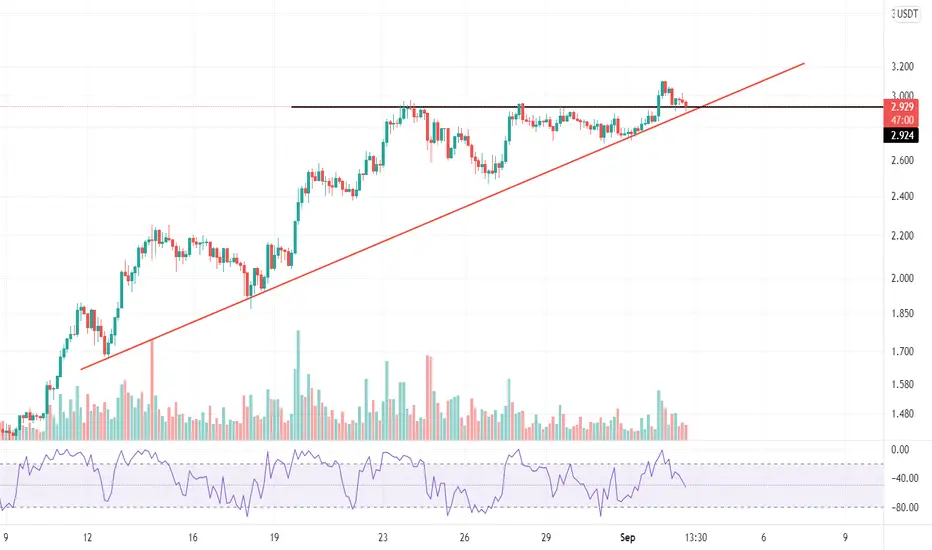
ADA is about to riseImminent to $2.55...ADA was consolidating for a few days. A breakout from that small Wedge is more likely to initiate a bullish momentum again towards the $3.00 zone

ADA/USDT According to the adx index, the price can go down. The next important support is $ 2.30. $ 1.88.If $ 2.30 support is lost, the price can hit the uptrend line and we will see an uptrend after.Friends, push the like button, write a comment, and share with your mates - that would be the best THANK YOU.


Ascending pattern in ADA!Hello friends!
As you can see in the chart, Ada price was able to break out the resistance and rally to the level resistance.
How much do you think Ada price will increase after completing the pattern?
With best wishes!

Crypto Catastrophe Planning (Sol, Luna and ADA/Cardano)I have spent some time looking at the dollar (DXY, see the linked Idea please) and it has a lot of upside potential based on some simple TA on the monthly time frame. Based on that potential prolonged dollar strength I think some crypto Crypto Catastrophe Planning is in order.
Last bear market one of my favorite analysts, Francis Hunte, called his XRPBTC short the gift that keeps on giving due to its continued downtrend trend on the weekly. Of course you don't get the same gains perhaps as being in and out of bounces on XRPUSD but you save yourself a lot of mental energy from the chop up and down that we see below. XRPUSD rallied less than BTCUSD, which means a red day/weeks for XRPBTC, and it dumped more than BTCUSD, which means another red day or week for XRPBTC. An entry within the blue triangle of XRPBTC looking for a break down would have been very profitable for the patient.
If we take the same idea for our catastrophe planning we would be looking for structures that we can play technically for entries that could pay out for the next six to nine months, or even longer. Cardano is in a rising wedge with three touches on the support and 2 touches on the top. That gives us a structure to play very technically. SolBTC has popped out of a rising wedge. That is very much blow off top behavior and often we see price action find tenuous support on previous resistance before falling through the wedge. Then price action has a chance to turn previous wedge support into resistance.
I have taken a short on ADAUSD due to the weakness I see on the daily chart for both ADAUSD and ADABTC with a stop loss taken at the high. I have two flat topped red HA candles and I will be looking for the wedge break down. If I see the ADABTC wedge breaking down I will put on a ADABTC short
SOLUSD is likewise popping out of its rising wedge but hasn't shown the weakens I want for a short just yet. There is a pregnant HA candle so I could go in with a sell stop but Imma hold off SolUSD and SolBTC shorts for now
LunaUSD looks very primed for a move to the downside. It is in a rising wedge and has bearish divergence on the 8 hour time frame. Once we see some downward movement we can evaluate if we think it will be prolonged or perhaps continue to chop. I am holding off on shorting for now.

Cardano ADAUSD - Rounding Bottom! + Elliott Wave +1000% gains- Cardano is currently breaking out to new ALL TIME HIGHS!
- On the chart we can spot a Symmetrical triangle - The price is creating higher lows and lower highs.
- Also, the price is above the ALL TIME HIGH level from 2018, which is very bullish .
- We will experience an acceleration to the upside in a few days!
- Profit target is 0.618 FIB extension, which is around 30 USD - 1000%.
- Cardano made a huge rounding bottom or cup and handle on the weekly time frame.
- For expected duration of the trade, probability, stop loss, profit target, entry price and risk to reward ratio ( RRR ) - please check my signature below ↓
- Due to my Elliott wave count, we are currently at the 5th impulse elliott wave!
- If you want to see more of these ideas, hit "Like" & "Follow"!

ADA Trouble Ahead?!Hello IWealth Here, I have been Trading and Teaching for 7 years. and im happy to share my idea that could help you in the crypto space.
------------------------------------------------------------------------------------------------------------------------------------------------------------------------
I Expect ADA to have a small bounce to around 2.60-2.75 follow by another leg down. I see strong support in the $1.50-1.80 range. That area is where we will be looking to accumulate again.

ADABTCADABTC WEEKLY chart review. very heavy overhead resistance, and supply zone for ADABTC. limited upside from here. CARDANO 40%+ CORRECTION SOON. be careful / don't get caught up. CORRECTION MODE SOON. expecting correction/pullback mode. previously maxed out and distribution wave 2 break down. STAGE2 DUMP pending soon, weak bounce possible from here. market not ready for BULL RUN yet. correction MODE to extend into SEPT/OCT 2021.

ADABTC WK1: CARDANO 40%+ CORRECTION WARNING(NEW)Why get subbed to me on Tradingview?
-TOP author on TradingView
-2000+ ideas published
-15+ years experience in markets
-Professional chart break downs
-Supply/Demand Zones
-TD9 counts / combo review
-Key S/R levels
-No junk on my charts
-Frequent updates
-Covering FX/crypto/US stocks
-before/after analysis
-24/7 uptime so constant updates
🎁Please hit the like button and
🎁Leave a comment to support our team!
ADABTC WK1: CARDANO 40%+ CORRECTION WARNING(NEW)
IMPORTANT NOTE: speculative setup. do your own
due dill. use STOP LOSS. don't overleverage.
🔸 Summary and potential trade setup
::: ADABTC WEEKLY chart review
::: ALWAYS DO YOUR OWN DUE DILL
::: very heavy overhead resistance
::: and supply zone for ADABTC
::: limited upside from here
::: CARDANO 40%+ CORRECTION SOON
::: be careful / don't get caught up
::: CORRECTION MODE SOON
::: expecting correction/pullback mode
::: previously maxed out and
::: distribution wave 2 break down
::: STAGE2 DUMP pending soon
::: weak bounce possible from here
::: STAGE2 DUMP up to 50% LOSSES
::: BE CAREFUL and don't get caught in this
::: market not ready for BULL RUN yet
::: correction MODE to extend into SEPT/OCT 2021
::: similar setup in other alt coins so be careful
::: also overextended right now
::: BULLS remain on sidelines and
::: good luck traders!
🔸 Supply/Demand Zones
::: N/A
::: N/A
🔸 Other noteworthy technicals/fundies
::: TD9 /Combo update: N/A
::: Sentiment mid-term: BEARS/CORRECTION MODE
::: Sentiment short-term: BEARS/CORRECTION MODE
RISK DISCLAIMER:
Trading Crypto, Futures , Forex, CFDs and Stocks involves a risk of loss.
Please consider carefully if such trading is appropriate for you.
Past performance is not indicative of future results.
Always limit your leverage and use tight stop loss.

-ADA- Pump incoming?Ada just saw a serious inflow of cash. Might be a good buy. Found support on the 200ema on the hourly.

long at 30 time chzusdtplease follow me
If you born poor
it’s not your mistake
But if you die poor it’s your mistake

ADA - Update ✅This sure looks like a confirmation. But the demand isn't as high as it must be.
Also I can't see any good buy volumes on any platforms for ADA, meaning that it's very risky at the moment to enter or open long positions.
Let's see what happens. If it manages to to confirm above support and pump back up, there are two key resistance areas on the way, watch out for them.
I'll keep this chart updated.
Use this chart as your trade setup for now.
Current Market Price: $2.934
Good Luck
Tell me your ideas. Like and Share

ADA - Ready for breakoutADA - IMO it's gearing up for a breakout. Though all I, going on is a trend line, volume and price action. The chamber is loaded...question is are we going for 3.50?

Simple but smartThere is credible support that is a good place to buy if this support is maintained
The triangle pattern is also well formed.
Please follow me
Adausdt buy opportunity!!Cardano is fundamentally and technically, can rise. Just needs to break this 📐.

ADA Another Leg UP!Hello IWealth Here, I have been Trading and Teaching for 7 years. and im happy to share my idea that could help you in the crypto space.
------------------------------------------------------------------------------------------------------------------------------------------------------------------------
Structure
Ada is in a bulling ascending triangle, and with this structure it typically breaks to the upside about 70% of the time.
RSI
We can see we are breaking out higher level of the rsi price, so this can have the price of cardano move upward.
Price Discovery can create strong fomo, however please be careful we are getting a bit overextending so I would not use any leverage and I would be looking to take profit soon maybe around the 3.60 -3.80 mark!

Cardano ADAUSD - Elliott Wave + Rounding Bottom! +1000%- Cardano is currently breaking out to new ALL TIME HIGHS!
- On the chart we can spot a Symmetrical triangle - The price is creating higher lows and lower highs.
- Also, the price is above the ALL TIME HIGH level from 2018, which is very bullish .
- We will experience an acceleration to the upside in a few days!
- Profit target is 0.618 FIB extension, which is around 30 USD - 1000%.
- Cardano made a huge rounding bottom or cup and handle on the weekly time frame.
- For expected duration of the trade, probability, stop loss, profit target, entry price and risk to reward ratio ( RRR ) - please check my signature below ↓
- Due to my Elliott wave count, we are currently at the 5th impulse elliott wave!
- If you want to see more of these ideas, hit "Like" & "Follow"!

ADABTC - Solid long play on the ascending triangle breakoutADA-BTC broke out of an ascending triangle with a 19% measured move target of ~7100 satoshis

ADA long?BB compressing, trend being respected, resistance about to get destroyed .. or donwside we go? lets see...

ADA/USDT LongADA is making a pennant pattern also it's an uptrend making higher high and supported by median line.
