ADA LONG SETUPHi, dear traders. how are you ? Today we have a viewpoint to BUY/LONG the ADA symbol.
For risk management, please don't forget stop loss and capital management
When we reach the first target, save some profit and then change the stop to entry
Comment if you have any questions
Thank You
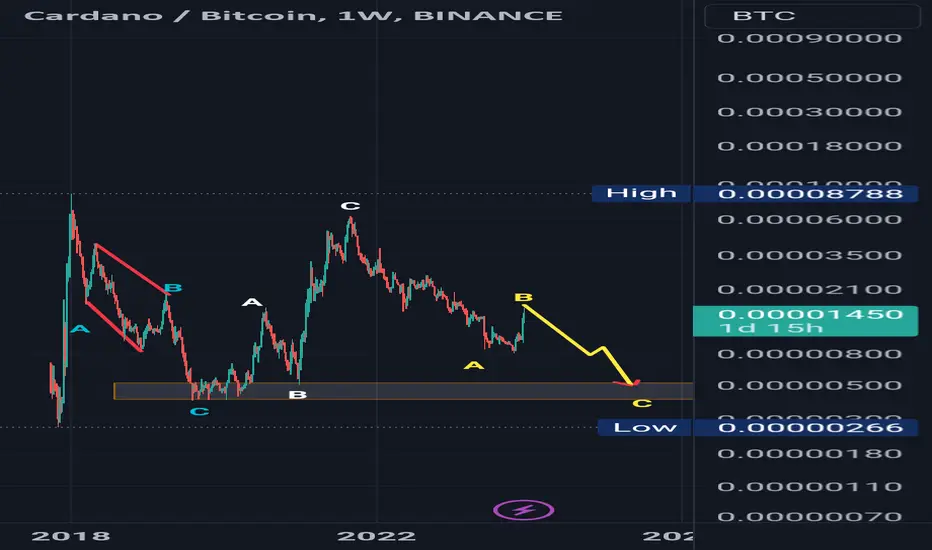
ADABTC

ADABTCThere is a historical support area below and the price has not touched it yet, so I think it will touch it to take a beat from it and start the rise of a new motive. At that time, all the data has been explained on the chart.
Note: I am only sharing my point of view and what I see, and it may be wrong or right, so make your own analysis
Good luck
ADA/USDT 1DAY UPDATE BY CRYPTOSANDERS !!Hello friends, welcome to this ADA/USDT update from Crypto Sanders.
Chart Analysis:- ADA bulls woke up this week with an impressive 28% price increase. This spectacular performance obliterated the resistance at 46 cents, and now buyers are looking at much higher levels.
The most important resistance on the chart right now is found at 60 cents. Sellers may attempt to stop this rally around 50 cents, but that is unlikely to last, considering market sentiment.
ADA manages to maintain this momentum, and then going to 60 cents becomes likely.
I have tried to bring the best possible results in this chart.
If you like it, hit the like button and share your charts in the comments section.
Thank you.

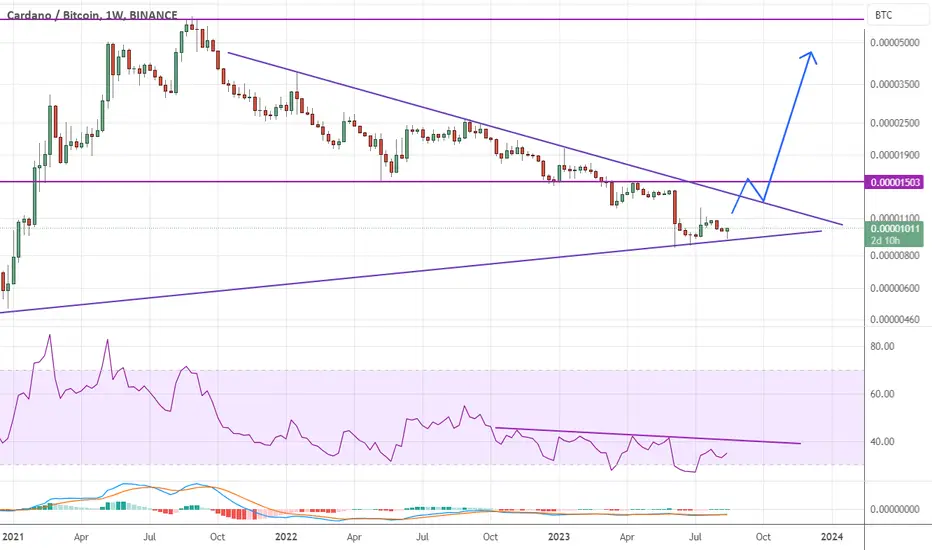
Cardano ADA/BTC Trade Opportunity ADA/BTC
Keeping it simple
▫️ 4th time ever weekly RSI was this over sold
▫️ 116 week High to Low completing 20th Nov
▫️ Breakout window 20th Nov 2023 - 29th Jan 2024
▫️ Bull trend confirmation = break above 50 week SMA
▫️ Great risk/reward here, stop under diagonal support
And then PATIENCE

Above 0.3808, full-fledged upward trend beginsHello traders!
If you "Follow" us, you can always get new information quickly.
Please also click “Boost”.
Have a good day.
-------------------------------------
(ADAUSDT chart)
The chart showing the same movement as the current ADA is ambiguous.
The reason is that if you look at the 1D chart or 1W chart, they are showing an upward trend no matter what anyone says.
So, you would expect it to be on the rise, but looking at the 1M chart you can see that's not the case.
(1W chart)
If you look closely at the chart, you can see that it is not in an upward trend, but is just trying to break out of the bottom.
Therefore, it can be said that the upward trend is likely to begin only when the price rises above 0.3808 and is maintained.
(1D chart)
Looking at the 1D chart in a narrow range, it seems that it is showing a tremendous upward trend.
Therefore, looking at the current movement, it may seem that the price is about to turn to the downside.
Therefore, even if it rises above 0.3824 and shows support, you are too scared to buy it and just look at it.
As you can see from the 1M chart and 1W chart, these charts are just showing signs of breaking out of the bottom section.
Therefore, it is time to buy when it rises above 0.3808 and shows support.
If you wait for fear that the price will fall further when it is at the bottom, and wait for the price to start falling when it rises to a critical point, you will inevitably end up buying at a bad purchase price.
Therefore, you need to make aggressive purchases with an investment proportion that does not cause psychological damage, watch and respond.
In a rising market, you should look for an opportunity to buy when the 1D chart is a falling candle, and in a falling market, you should look for an opportunity to sell when the 1D chart is a rising candle.
Therefore, in a rising market, you should buy when there is a pull back pattern, and in a falling market, you should buy through a breakout trade.
Based on these basic trading strategies, you must create a trading strategy that suits you and start trading.
--------------------------------------------------
- The big picture
The full-fledged upward trend is expected to begin when the price rises above 29K.
This is the section expected to be touched in the next bull market, 81K-95K.
-------------------------------------------------- -------------------------------------------
** All explanations are for reference only and do not guarantee profit or loss in investment.
** Trading volume is displayed as a candle body based on 10EMA.
How to display (in order from darkest to darkest)
More than 3 times the trading volume of 10EMA > 2.5 times > 2.0 times > 1.25 times > Trading volume below 10EMA
** Even if you know other people’s know-how, it takes a considerable amount of time to make it your own.
** This chart was created using my know-how.
---------------------------------


ADA ANALYSIS (1D)Hi, dear traders. how are you ? Today we have a viewpoint to BUY/SELL the ADA symbol.
For risk management, please don't forget stop loss and capital management
When we reach the first target, save some profit and then change the stop to entry
Comment if you have any questions
Thank You

Below 0.2441 : Entering the bottom sectionHello?
Hello traders!
If you "Follow" us, you can always get new information quickly.
Please also click “Boost”.
Have a good day.
-------------------------------------
(ADAUSDT chart)
The key is whether the price can be maintained above 0.1720 and rise above 0.2974.
(1D chart)
Falling from the current position could mean falling to the bottom, so a countermeasure is needed.
Accordingly, the key is whether it can receive support and rise in the box range of 0.2441-0.2580.
If this is not possible and the price falls and shows resistance, a stop loss is necessary.
-------------------------------------------------- -------------------------------------------
** All explanations are for reference only and do not guarantee profit or loss in investment.
** Trading volume is displayed as a candle body based on 10EMA.
How to display (in order from darkest to darkest)
More than 3 times the trading volume of 10EMA > 2.5 times > 2.0 times > 1.25 times > Trading volume below 10EMA
** Even if you know other people’s know-how, it takes a considerable amount of time to make it your own.
** This chart was created using my know-how.
---------------------------------

Cardano (ADA) long before the breakIf ADA retrace to 0.275 (FIB-level 0.38) - I think it's in a good position for a spot trade.
I predict the ADA-bottom is in and we can aspect some big fast move as soon as ADA break the trend-line.
ADA have been tanking for years now and I believe that there are a lot of hungry bulls that will show up to find an entry for a long time hold.
I don't think we will get any good opportunities to buy the retest after a potential trend break.
So my idea here is to front run the potential big move :)

ADA/BTC Potential Harmonic PatternADA/BTC Potential Harmonic Pattern, but keep an eye on the trendline Resistance.
................................................................................................................
We are not registered or licensed in any jurisdiction whatsoever to provide investing advice or anything of an advisory or consultancy nature.
and are therefore are unqualified to give investment recommendations.
Always do your own research and consult with a licensed investment professional before investing.
This communication is never to be used as the basis of making investment decisions, and it is for entertainment purposes only.

ADA/USDT 1DAY UPDATE BY CRYPTOSANDERS !!Hello friends, welcome to this ADA update from Crypto Sanders.
Chart Analysis, Cardano finally managed to move above 25 cents, and the price has been rallying ever since confirming this level as support. This allowed the price to close the week with a 5% increase.
The next resistance on the chart is found at 28 cents. If this momentum is maintained, ADA could reach this later next week. This is a welcomed change in the price action since Cardano has been stuck in a downtrend for the past three months.
ADA has a good opportunity to capitalize on these recent gains and push higher, provided the overall market does not turn bearish.
I have tried to bring the best possible results in this chart.
If you like it, hit the like button and share your charts in the comments section.
Thank you.

ADA/USDT 1DAY UPDATE BY CRYPTOSANDERS !!hello, welcome to this ADA/USDT update by CRYPTO SANDERS.
CHART ANALYSIS:- Cardano (ADA) was a notable gainer, with the cryptocurrency climbing away from a floor of its own.
ADA/USD rose to a high of 0.2628 earlier in the day, which comes after a low of 0.255 the day prior.
Today’s move saw Cardano move away from its recent support point at 0.250, just as the RSI bounced from a floor of its own.
After colliding with a floor at the 55.00 mark, price strength has gone on to reach a high peak at 58.82.
The next visible ceiling looks to be at the 65.00 zone, and in the event bulls manage to reach this point, ADA will likely rise above 0.270.
I have tried to bring the best possible outcome to this chart.
Hit the like button if you like it and share your charts in the comments section.
Thank you

Cardano ADA/BTC - Patience Required ADA/BTC Weekly Chart #ADA
A chart worth keeping an eye on #CardanoADA
- RSI Oversold for 2nd time ever
- Break out of bearish channel (Pending)
- Break above 50 SMA with turn up (Pending)
- Zones are rough guides.
- 115 weeks is a time guide as this was the last timeframe from
top to the bottom before bull market started. We are only at week 83.
You could nibble here. ill be waiting & watching for the break of the channel and the 50 SMA.
PUKA

I Shorted ADA/BTCAda, much like Etherium, will be dumpoing against Bitcoin. Probably much faster.
There are new updates to the Bitcoin layer two, which will slowly but surely give it all the capabilities that people seek for in other cryptos.

ADA/USDT 1DAT UPDATE BY CRYPTOSANDERS !!hello, welcome to this ADA/USDT update by CRYPTO SANDERS.
CHART ANALYSIS:- Cardano is also found in a flat trend above the key support at 25 cents. For this reason, its price registered a minor loss of 1.3% this week. Sellers were unable to break this support even though they tried several times.
While ADA bulls have shown strength so far, bears could continue to put pressure on the key support. If more tests happen, buyers could become exhausted, which can create an opportunity for a breakdown.
the price action appears fragile to any renewed volatility across the market, particularly if the market leaders such as BTC and ETH decide to drop lower. In such a case, ADA could go to 24 cents again.
I have tried to bring the best possible outcome to this chart.
Hit the like button if you like it and share your charts in the comments section.
Thank you

ADABTC looks bullish AF !!Look at that latest weekly candle! Hammer doji!
Bullish!
When we break the diagonal trendline, it'll be party time!
ADA/BTC - Cardano: Ascending_Triangle◳◱ We've detected an Ascending Triangle pattern on the CRYPTOCAP:ADA / CRYPTOCAP:BTC chart. This pattern is a bullish indication and could indicate a potential trend reversal. The next resistance levels are at 0.00000969 | 0.00000994 | 0.00001044 and the major support zones are respectively at 0.00000919 | 0.00000894 | 0.00000844.
◰◲ General info :
▣ Name: Cardano
▣ Rank: 8
▣ Exchanges: Binance, Kucoin, Huobipro, Gateio, Poloniex, Mexc
▣ Category/Sector: Infrastructure - Smart Contract Platforms
▣ Overview: Cardano is an open-source, smart-contract platform that aims to provide multiple features through layered design. Its modularization will eventually allow for network delegation, sidechains, and light client data structures. Cardano uses a version of Proof-of-Stake (PoS) called Ouroboros to secure the network and manage the block production process. The network features a native token called ADA that gives stakers a claim on new issuance in proportion to their holdings and allows users to pay for transactions.
◰◲ Technical Metrics :
▣ Mrkt Price: 0.0000096 ₿
▣ 24HVol: 75.640 ₿
▣ 24H Chng: 1.159%
▣ 7-Days Chng: -0.51%
▣ 1-Month Chng: 6.88%
▣ 3-Months Chng: -28.15%
◲◰ Pivot Points - Levels :
◥ Resistance: 0.00000969 | 0.00000994 | 0.00001044
◢ Support: 0.00000919 | 0.00000894 | 0.00000844
◱◳ Indicators recommendation :
▣ Oscillators: BUY
▣ Moving Averages: STRONG_BUY
◰◲ Technical Indicators Summary : STRONG_BUY
◲◰ Sharpe Ratios :
▣ Last 30D: -0.47
▣ Last 90D: -2.17
▣ Last 1-Y: -0.44
▣ Last 3-Y: 0.77
◲◰ Volatility :
▣ Last 30D: 0.55
▣ Last 90D: 0.55
▣ Last 1-Y: 0.68
▣ Last 3-Y: 1.06
◳◰ Market Sentiment Index :
▣ News sentiment score is 0.51 - Bullish
▣ Twitter sentiment score is 0.55 - Bullish
▣ Reddit sentiment score is 0.38 - Bearish
▣ In-depth ADABTC technical analysis on Tradingview TA page
▣ What do you think of this analysis? Share your insights and let's discuss in the comments below. Your like, follow and support would be greatly appreciated!
◲ Disclaimer
Please note that the information and publications provided are for informational purposes only and should not be construed as financial, investment, trading, or any other type of advice or recommendation. We encourage you to conduct your own research and consult with a qualified professional before making any financial decisions. The use of the information provided is solely at your own risk.
▣ Welcome to the home of charting big: TradingView
Benefit from a ton of financial analysis features, instruments and data. Have a look around, and if you do choose to go with an upgraded plan, you'll get up to $30.
Discover it here - affiliate link -

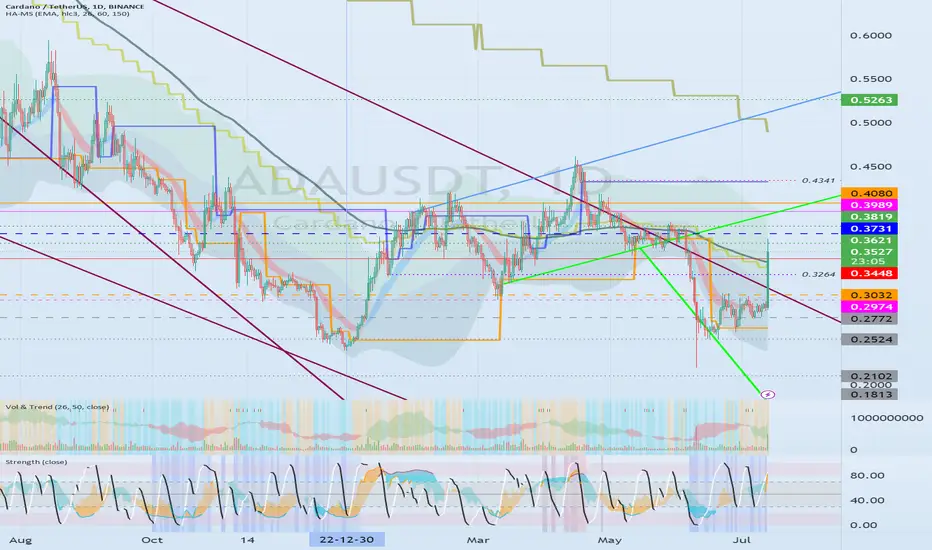
The 0.4080 point is the divergence point of the rise and fallHello?
Traders, welcome.
If you "Follow", you can always get new information quickly.
Please also click "Boost".
Have a good day.
-------------------------------------
(ADAUSDT chart)
This rise did not turn the trend into an uptrend.
Therefore, I think that the movement to switch to an upward trend will begin only when the price rises above the 0.3032-0.3731 section and maintains it.
I would expect the price to hold above 0.4080 to start a full-fledged uptrend.
The timing of purchase is important for investment, that is, trading, but in the end, you must think about the increase compared to the investment period and decide.
In that sense, if it rises above 0.4080, ADA is a good coin to trade from a mid- to long-term perspective.
-------------------------------------------------- -------------------------------------------
** All descriptions are for reference only and do not guarantee profit or loss in investment.
** Even if you know other people's know-how, it takes a considerable period of time to make it your own.
** This is a chart created with my know-how.
---------------------------------
ADA/USDT 1DAY UPDATE BY CRYPTO SANDERSHello, welcome to this ADA/USDT update by CRYPTO SANDERS.
CHART ANALYSIS:- Cardano (ADA) plunged to a three-month low on Thursday, as traders remained nervous, following the recent U.S. Securities and Exchange Commission (SEC) lawsuits.
After a high of 0.3376 on Wednesday, ADA/USD dropped to a bottom at 0.3196 earlier in today’s session.
The drop pushed the token to its lowest level since March 15, when price was at a bottom of 0.3166.
this decline came as the relative strength index (RSI) moved deep into oversold territory, falling to a low below 30.00.
The index has since rebounded, and is tracking at 34.21, which is marginally above a key level of resistance at the 33.00 mark.
Should this upward momentum continue, bulls will look to recapture the 0.3500 level.
I have tried to bring the best possible outcome to this chart.
Hit the like button if you like it and share your charts in the comments section.
Thank you

ADA/USDT 1DAY UPDATE BY CRYPTO SANDERSHello, welcome to this ADA/USDT update by CRYPTO SANDERS.
CHART ANALYSIS:- Cardano (ADA) was one of Friday’s notable gainers, as the token snapped a key resistance level.
ADA/USD rose by as much as 3% in today’s session, hitting an intraday high of 0.3777 as a result.
This rally resulted in the 10-day (red) moving average crossing over its 25-day (blue) counterpart.
Typically such an upwards crossover signals the start of a bull run, and it comes as the relative strength index (RSI) also rose considerably.
the index is tracking at 50.91, which is marginally below a resistance level of 52.00.
In the event this ceiling is broken, there is a strong chance that ADA will move toward the 0.3800 mark.
I have tried to bring the best possible outcome to this chart.
Hit the like button if you like it and share your charts in the comments section.
Thank you

ADA analysis (4H)Hi, dear traders. how are you ? Today we have a viewpoint to BUY/LONG the ADA symbol.
For risk management, please don't forget stop loss and capital management
When we reach the first target, save some profit and then change the stop to entry
Comment if you have any questions
Thank You

ADA/USDT 1DAY UPDATE BY CRYPTO SANDERSHello, welcome to this ADA/USDT update by CRYPTO SANDERS.
CHART ANALYSIS:- Cardano (ADA), was also in the green to start the weekend, with prices moving further away from a recent support level.
ADA/USD hit an intraday high of 0.3667 earlier in today’s session, which comes following a low of 0.3564 on Friday.
The move has resulted in Cardano climbing to its strongest point since Wednesday, moving away from the aforementioned floor at 0.3550 in the process.
ADA has begun to consolidate, with the price now retreating from its earlier highs, following a collision with a ceiling on the RSI.
Price strength has failed to move past a point of resistance of 44.00 which has pushed the token to a current reading of 0.3638.
I have tried to bring the best possible outcome to this chart.
Hit the like button if you like it and share your charts in the comments section.
Thank you

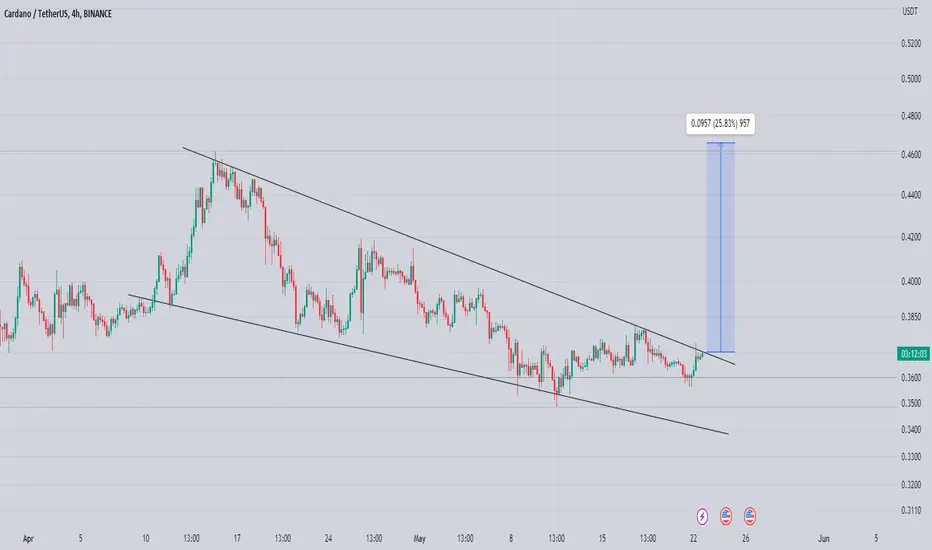
Cardano testing Crucial Area Formed & Breaking Falling Wedge In h4 Timeframe Incase Of breakout expecting Move towards 0.50$ Keep Eyes On Ada For Breakout