ADABTC


Cardano is on track to complete elliot wave cycle to $3+Big pump before BTC crash - ADA holders are unfazed. Technology is finally catching up to the $1 hype from 2017. It was funny seeing crypto twitter buy the dip all the way down to $.05 during crypto winter, but the strong hands prevailed and was handsomely rewarded. I expect NVDA stock split stock to save ETH and carry BTC back to $50k (BTC is currently at $38k). Elon and friends had a fun time stop loss hunting and grabbing cheap coins. Energy consumption attack on BTC was a nice way to pump ADA to create higher support before they dumped the BTC. We should see overall crypto market higher next month as May BTC future contracts come to an end this week. final target of full elliot wave cycle on ADA with BTC at $50k should take ADA to $3+. Let's take profits after NVDA splits in July.

Cardano price pace sets recovery for altcoinsCardano plunged from highs around $2.4 amid the broad-based cryptocurrency declines. The losses extended below $2 before the bulls regained balanced at $1.4. Like Bitcoin, ADA immediately started a reflex recovery where the gap to $2 was almost closed on Thursday.
Despite leading altcoins in recovery, Cardano stalled under $2 and, more specifically, at the 50 Simple Moving Average (SMA) on the four-hour chart. A correction ensued, allowing bears to come into play.
At the time of writing, ADA is doddering at $1.75 after losing the key support at $1.8, provided by the 50 SMA. Higher support is needed for the bulls to concentrate on recovery fully. However, all is not lost because short-term technical levels appear steady.
Cardano rejected at the 50 SMA, but bulls focus on $2.4
The Moving Average Convergence Divergence (MACD) on the four-hour chart has a bullish impulse. For instance, the MACD line (blue) has crossed above the signal line, insinuating that it was time to buy into Cardano.
Note that the MACD is a chart overlay indicator tracking the trend of an asset and measuring its momentum. Although it does not suggest whether an asset is overbought or oversold, the MACD helps identify positions to buy the dip or sell the bottom.
A confirmed break above the 50 SMA will assist in guaranteeing the journey above $2 and toward the all-time high at $2.4.
However, the Relative Strength Index (RSI) has a bearish outlook, hinting at a more extended correction. As the RSI drops under the midline, overhead pressure rises; thus, jeopardizing support levels at $1.6 and $1.4.
Cardano intraday levels
Spot rate: $1.75
Trend: Bearish
Volatility: Low
Support: $1.6 and $1.4
Resistance: $1.8 and $2

Cardano ADABTC bidding zone Cardano is one of the most slow moving boring Alts while fundamentally it’s very strong and has been hibernating for so long in a slow ascending stage. It has all the fundamentals to make a big pump anytime, but since it just broke out from the EMA, I’d bid for this pair at the blue line as I expect a retest before going north.
Do you agree with my entry target? Feel free to share yours.


ADA Sell a break of $2ADAUSDT - Intraday - We look to Sell a break of 1.996 (stop at 2.091)
We are trading at overbought extremes.
A higher correction is expected.
Trading close to the psychological 2.000 level.
We need to see a break of bespoke support (at 2.000) to confirm the negative outlook.
Rallies should be capped by yesterday's high.
Our profit targets will be 1.751 and 1.571
Resistance: 2.200 / 2.400 / 2.500
Support: 2.000 / 1.850 / 1.750

Cardano (ADA) - May 17Hello?
Dear traders, nice to meet you.
By "following" you can always get new information quickly.
Please also click "Like".
Have a good day.
-------------------------------------
(ADAUSD 1W chart)
The important support zone is 1.31605953-1.54665122.
You have to watch to see if it rises along the uptrend line.
(1D chart)
We have to see if we can get support at 2.24350456 and climb above 2.55258915.
If it falls, you need to make sure you get support at 2.14047637-2.24350456
If you fall from 1.62533538-1.72836357, you need a short stop loss.
The next volatility period is around May 20th.
-------------------------------------
(ADABTC 1W chart)
(1D chart)
We have to see if we can get support at the 4789 Satoshi point and climb above the 5700 Satoshi point.
If it falls, you need to make sure you get support in the 4580 Satoshi-4789 Satoshi section.
If you fall in the 3536 Satoshi-3745 Satoshi section, a short stop loss is required.
--------------------------------------
It is advisable to trade at your average unit price.
This is because if the price flows below your average unit price, which was on an uptrend or downtrend, there is a high possibility that you will not be able to earn a large profit due to the psychological burden.
The center of every trade starts with the average unit price you start trading.
If you ignore this, you may be trading in the wrong direction.
Therefore, it is important to find a way to lower the average unit price and adjust the proportion of the investment, so that the money that ultimately corresponds to the profit can regenerate the profit.
-------------------------------------------------- -------------------------------------------
** All indicators are lagging indicators.
So, it's important to be aware that the indicator moves accordingly with the movement of price and volume.
Just for the sake of convenience, we are talking upside down for interpretation of the indicators.
** The wRSI_SR indicator is an indicator created by adding settings and options from the existing Stochastic RSI indicator.
Therefore, the interpretation is the same as the conventional stochastic RSI indicator. (K, D line -> R, S line)
** The OBV indicator was re-created by applying a formula to the DepthHouse Trading indicator, an indicator that oh92 disclosed. (Thank you for this.)
** Check support, resistance, and abbreviation points.
** Support or resistance is based on the closing price of the 1D chart.
** All explanations are for reference only and do not guarantee profit or loss on investment.
Explanation of abbreviations displayed on the chart
R: A point or section of resistance that requires a response to preserve profits
S-L: Stop Loss point or section
S: A point or segment that can be bought for profit generation as a support point or segment
(Short-term Stop Loss can be said to be a point where profits and losses can be preserved or additionally entered through installment transactions. It is a short-term investment perspective.)
GAP refers to the difference in prices that occurred when the stock market, CME, and BAKKT exchanges were closed because they do not trade 24 hours a day.
G1: Closing price when closed
G2: Market price at the time of opening
(Example) Gap (G1-G2)

1 ada = 2.48 Is valid. Island is an island. Btc is of course affected by the Eth drop. But Ada is a coin that has not experienced its full explosion yet.
There is a goal of 12-14 dollars in the future.
The most important issue is that the people who enter the island are generally corporate and far from short selling.
Since the sale is made while the price increases, the money inside always stays the same or increases.
I always tactic the ruler of the island.
We took the island from the bottom.
We are increasing the number of islands.
Not investment advice.
The reason I wrote this is because you buy and sell investments at your own discretion.
If you are in Germany, we can get 1 year investment with the contract.

Cardano ADA is Heading for 7$Hello,
Cardano has just entered into the price discovery so i might have to use technical tools more than the historical data cause its printing it right now so i am unable to anticipate based on delta data.
but here you can see based on fib and Elliot theory price is perfectly heading towards wave 5
i choose kraken as it has a perfect full chart for ada.
Cheers.

ADA BOOMING!Cardano is exploding ! Dont sell for anything less than $3.34EASY money here guys. 5-10$ coin by end of bull Run. Gonna follow one of these 2 paths up. Fast track or medium trajectory . Either look great to me!

In Bitcoin 80.000$ Not Joke. + %80#Bitcoin will definitely go for $ 80,000. But first they wanted altcoin season.
It looks like everyone will run to bitcoin when the altcoin season stops.
It may even be 95 thousand dollars. I am not kidding.
We are Preparing for the Future. #Btc Legend will rise in the future.
Follow the rise in Ethereum. I have a target of -69-73-80-95-120 thousand dollars for Btc the moment #Ethereum stops rising and I don't think we will understand what this will come very fast.
Whales in the market are buying BTC. And whales don't easily buy high-volume bitcoins.
Don't Forget These Days. #Hodl
When It's Time to Rise Nobody can hold bitcoin.
It can fall to 38 thousand. Progressive Buying is correct.
You can zoom in on my analysis in my articles about Bitcoin.
How they keep it, How they will keep it, My analysis will come.
not investment advice.

Very Cheap CARDANO / ADA 3.05 $Bitcoin and Ethereum are falling, the island does not fall.
Let's not neglect to collect Fruits that will appear as Peak to Us when Btc and Eth de fall.
Get tp. Stop-loss = 1.96 $ There is a high chance of winning. But it is still affected by the rise and fall of bitcoin.
When the time comes, no one can afford to pay $ 3 within 4 hours at most.
The money entering Cardano is generally fixed inside, the market does not go below a minimum of $ 35 billion
Their investors are solid, so they don't take the act of short selling.
A coin is not short-selling, it always increases, albeit slowly. I suggest you read my old articles.
I don't think it will go below $ 3 in the future, not investment advice.
But be careful when buying for the first $ 3 visit.
If he enters full bull, his first goal is $ 4, his next target goes up to $ 12-14.
Do not forget to take Tp and set your Stop-loss.


ADA CARDANO - Updated Big Chart Believe it or not, despite the huge rise, this is now AGAIN a great entry point!
I am trying to keep it simple guys, extra simple, no indicators, not fancy words, no rocket science here (at least what you get to see from me anyways).
Hope it helps, hope it works.
One Love,
the FXPROFESSOR

CARDANO: BULLISH TREND - CARDANO IS UNSTOPPABLE ! LONG SETUP 🔔Welcome back Traders, Investors, and Community!
Check the Links on BIO and If you LIKE this analysis, Please support our page by hitting the LIKE👍 button
Traders, if you like this idea or have your own opinion about it, please write your own in the comment box . We will be glad for this.
Feel free to request any pair/instrument analysis or ask any questions in the comment section below.
Have a Good trading day!

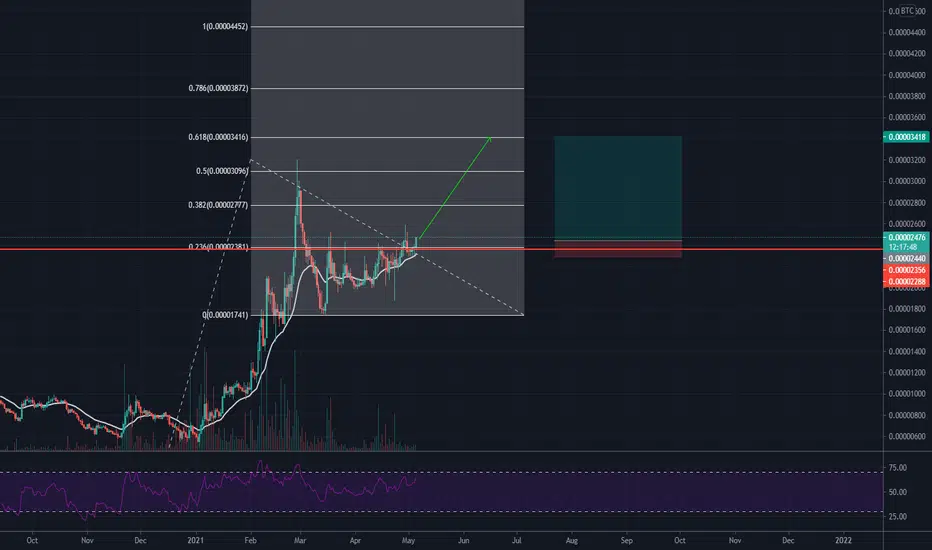
ADABTC - Cardano weekly targets against BTCCardano is about to break resistance at the 0.5 fib extension line. Potential targets charted.


ADA ,time for growth ADA / USDT
cardano is one of good bullish structure in current market situation
Its had some stability above previous resistance
and we also have possible power of 3
as long as it hold this support area, I think time for 2nd leg up is very soon
Best wishes 🙏

Cardano could repeate the ethereum moveI will be waiting for cardano breakout and then a confirmation
In bullrun the start will be by ethereum, then large cap altcoins then small caps ,, we are now with altcoins large cap bullrun

ADA break the supply level best entry now you can see last chart about ADA
he break 1.55
w can enter now 1.534
SL : 1.358
TP : 1.871
Risk : 11%
Profit : 23%
