ADABTC - AnalysisFollow the signals. Sell at resistance, watch the blue line. If daily closed below, sell and potentially buy back at support.
ADABTC

Cardano (ADA) - May 1Hello?
Dear traders, nice to meet you.
By "following" you can always get new information quickly.
Please also click "Like".
Have a good day.
-------------------------------------
(ADAUSD 1W chart)
We have to see if we can get support at 1.31605953 and continue the uptrend.
(1D chart)
You should watch for any movement that deviates from the 1.22749797-1.51439437 section.
In particular, we have to see if we can get support at 1.31605953 and rise above 1.37094617.
If it falls from 0.94060159 point, a Stop Loss is required to preserve profit and loss.
However, you need to trade carefully as you can touch the 0.84429438 point and climb.
If you go up to 1.51439437-1.58611846, it is expected to determine the next direction.
Therefore, careful trading is necessary.
-------------------------------------
(ADABTC 1W chart)
(1D chart)
It remains to be seen if it can rise along the uptrend line and rise to the 2521 Satoshi-2662 Satoshi section.
--------------------------------------
It is advisable to trade at your average unit price.
This is because if the price flows below your average unit price, which was on an uptrend or downtrend, there is a high possibility that you will not be able to earn a large profit due to the psychological burden.
The center of every trade starts with the average unit price you start trading.
If you ignore this, you may be trading in the wrong direction.
Therefore, it is important to find a way to lower the average unit price and adjust the proportion of the investment, so that the money that ultimately corresponds to the profit can regenerate the profit.
-------------------------------------------------- -------------------------------------------
** All indicators are lagging indicators.
So, it's important to be aware that the indicator moves accordingly with the movement of price and volume.
Just for the sake of convenience, we are talking upside down for interpretation of the indicators.
** The wRSI_SR indicator is an indicator created by adding settings and options from the existing Stochastic RSI indicator.
Therefore, the interpretation is the same as the conventional stochastic RSI indicator. (K, D line -> R, S line)
** The OBV indicator was re-created by applying a formula to the DepthHouse Trading indicator, an indicator that oh92 disclosed. (Thank you for this.)
** Check support, resistance, and abbreviation points.
** Support or resistance is based on the closing price of the 1D chart.
** All explanations are for reference only and do not guarantee profit or loss on investment.
Explanation of abbreviations displayed on the chart
R: A point or section of resistance that requires a response to preserve profits
S-L: Stop Loss point or section
S: A point or segment that can be bought for profit generation as a support point or segment
(Short-term Stop Loss can be said to be a point where profits and losses can be preserved or additionally entered through installment transactions. It is a short-term investment perspective.)
GAP refers to the difference in prices that occurred when the stock market, CME, and BAKKT exchanges were closed because they do not trade 24 hours a day.
G1: Closing price when closed
G2: Cigar at the time of opening
(Example) Gap (G1-G2)

[UPDATE ADA] ADA/BTC IS SCREAMING: 14$!!!!!ADA/BTC is telling me something different. Something even more bullish.
Let's see.

Cardano (ADA) looks to go long Wave 3I''m starting to see a market-wide trend. We are getting prepped for a solid wave 3 through-out the altcoin market and Cardano is no different. After doing 10 or so charts in the last few days, there seems to be a common denominator, wave 3. But in this case, we will talk Cardano (ADA).
Cardano made some headlines earlier this year after it became the 3rd ranked cryptocurrency by market cap. This didn't last but a few days as the first wave of volatility had cryptocurrencies bouncing around like pinballs. This always seems to be the case as the first macro wave of the season settles in.
Elliot wave analysis: Unfortunately, newer investors rarely get to reap the benefits of early waves like wave 2 and 3. This is partly because we never know when wave 1 is formed until we see wave 2 completed. To put it simply, wave 1 will be made of a 5-wave structure, and Wave 2 will be a 3 wave (ABC) correction. This is a good area to go long. We can assume a wave 3 target of 1.5-1.618 the size of wave 1 using the fibonacci tool. In the case of Cardano, we have a little bit different structure taking place in the form of a triangle correction. In my eyes it looks like a contracting or sym. triangle correction. This type of triangle forms with decreasing volume, which has been labeled orange. No worries though, this is yet another way elliot waves can form and its good to study them. We are still looking like we are ready for macro wave 3. I use the word macro a lot when explaining elliot waves because I want to see people looking big picture, and then breaking down those waves into smaller sub-waves. It's a vicious cycle.
Short-term: watch closely for the beginning of wave 3 to take shape, slowly inclining price action.
Mid-term: If wave 3 takes shape, the assumed target would be in the .00004700-.00004800 range. (1.618)
Long -term: If you go long here, Take profits at previous high and at 1.618, or wait for confirmation of breakout above previous high and then go long.
All my opinion. Not financial advice.
Hoskinson doesn't seem to be letting up on being a contender.

Elliott Wave Analysis: XLMBTC + ADABTC With Corrective PatternsHello Crypto traders!
Today we will talk about XXX/BTC cross pairs in the Crypto market as we see interesting developments.
In the previous articles we shared ETHBTC cross pair and BTC.Dominance chart which we potentially see them approaching key and strong target levels.
In this article we want to show you another two examples of XLMBTC + ADABTC and why BTC may start dominating soon.
Well, if we take a look on XLMBTC, we can see mostly sideways price action and corrective wave structure since January and more and more looks like a bearish triangle formation, which is a corrective and continuation pattern that can send the price back to 0.0000035 lows, while it's beneath 0.000013 invalidation level.
Even ADABTC has a corrective wave structure since March. Just like XLMBTC, it can be also finishing an a-b-c correction, it's just different type of a correction called flag pattern, so here as well we can expect another reversal down back below 0.00001750 previous lows, while it's beneath 0.000032 invalidation level.
All that being said, be aware of a return of BTC.Dominance that can cause even more downside pressure for XXX/BTC cross pairs soon.
If you like what we do, then please like and share our idea!
Be humble and trade smart!
Disclosure: Please be informed that information we provide is NOT a trading recommendation or investment advice. All of our work is for educational purposes only.


ADA Clear Flag BuyLooking for MACD continuation and of the bullflag that has formed
I'm a bigger fan of ETH to ADA in my personal opinion, should the two be compared?

ADA ,can we see big move soon ?ADA / USDT
Cardano in the consolidation for more than 2 months
The strong resistance is begin tested 3 times before , Now we can see bulls try for the 4th time to break it
I expect big move soon after breaking long consolidation range 📈
Weekly candle closure can help us for more confirmations
Share your opinions & asks below

Ada/btc bullishAda/btc could be forming an ascending triangle on the 4H, Daily looks like it could be ready to start the next leg up in my opinion.

Cardano is about to move to $1.50!Cardano is looking like a good altcoin to buy in if we expect Bitcoin to move higher.
Good scalp trade example imo,
Buying break of $1.3436
Taking profit below $1.50.
Good luck!
Not financial advice btw. :)

Close to the breakout of ADABTC on High time frameClose to the breakout of ADABTC on High time frame


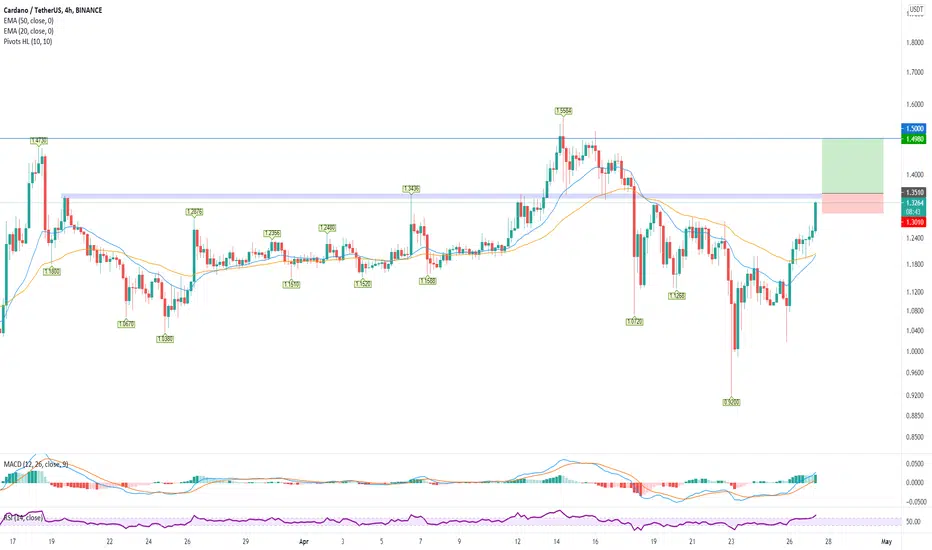
ADA Buy a break setup.ADAUSDT - Intraday - We look to Buy a break of 1.351 (stop at 1.301)
Daily signals are bullish.
Pivot resistance is at 1.343.
A break of bespoke resistance at 1.340, and the move higher is already underway.
We look for gains to be extended today.
Our profit targets will be 1.498 and 1.568
Resistance: 1.340 / 1.430 / 1.500
Support: 1.270 / 1.200 / 1.150
ADA Make 13% profits until now with the updatewe see ADA respect these level we update the idea for new buy from demand level

Don’t bet on ADA/BTC just yetADA has recovered already its loss in BTC terms from last week and it looks like it might be set to resume its upward trend. But ADA/BTC is well below its February high.
We’ve posted the following question to Hybrid Intelligence:
“The cryptocurrency Cardano (ADA/BTC) settled at 0.00002279 BTC at 10:02 AM UTC at the binance exchange on Monday, April 26. In your opinion, will ADA/BTC trade above 0.00002621 BTC (+15.0%) at any time before May 15?”
-------------------------------------
Assurance: 58%
While it's somewhat bullish, this means that Hybrid Intelligence does not have a strong conviction about ADA/BTC.
The relatively low BTC dominance of about 50% is favourable for alts yet perhaps ADA shouldn’t be the primary choice for a short-term trade.

ADA/BTC, Cardano/Bitcoin - a great potential👍Preconditions:
- price is in a range more than 1 month
- price made false breakout
- long movement near to the key level
I expect on squeezing, breakout and retest. Only after this scenario I'll open a position. Once more: only after retest.
Write in the comments all your questions and instruments analysis of which you want to see.
Friends, push the like button, write a comment, and share with your mates - that would be the best THANK YOU.
P.S. I personally will open entry if the price will show it according to my strategy.
Always make your analysis before a trade


ADABTC - Cardano quietly pushing through key resistanceCardano is currently testing key resistance against BTC on the daily.. as of this publication it's above the resistance line, but there are 17 hours to go on the daily candle, so waiting to see if the bulls can keep the grind up long enough to wear down the bears on increasing volume.
There's a cup and handle pattern at play with a target of around 2750 sats (not charted, but it's pretty easy to see), as well as continuation of the symmetrical triangle breakout with a target of 2979 sats.

Some levels to watchHello everyone, I hope you're doing well
Small update for ADA.
I was expecting a correction after hitting the 2$ mark but the volatility and the equilibrium formed at Bitecoin decided to push BTC/usd to oversold territory on the daily. A similar event can be seen on ADA/USDT where we have hit 30 points at the RSI for a brief oversold instant. I don't think this is over in USDT terms, Bitcoin has a big opportunity to go oversold and play the 41000$ support, this could lead to a potential correction for ADA in the 0.70$ /0.80$ area where two big supports stands. If this will happen, it should occur during the next 5 or 6 days or if the weekly candle closes under 1.03$ looking for the support of the EMA 26 currently at 0.75$. I don't really expect this now, as maybe this kind sounds crazy, because ADA didn't went parabolic yet to see a monthly consolidation (as other coins did like Theta or ENJ).
On the short term the 4 hrs and 12 hrs are not looking great. We have at the 4 hrs for the first time since September a bear cross of the EMAS 12 and 26 under the 200 and a test of the support on the 12 hrs of the MA 200 and EMA 200 suggesting a weekly consolidation (and so a touch of the EMA 26 on the weekly). On the 12 hrs (I don't have the timeframe to show) we can also see that the next support is at 0.80$ where if it closes there we will be oversold on the RSI.
Daily ADA/USDT
Weekly ADA/USDT
4hrs ADA/USDT
But here we are concerned about ADA/BTC. Despite the bearish (shorterm) perspective of ADA/USDT. ADA/BTC is not bearish. On the daily we can see that the trend is currently holding well over the EMA 26 and trading in a triangle. This triangle has strong possibilities to break bullish due to fundamentals next week (and the weekly close, see weekly hart) or in the worst case to continue sideways following the correlation with bitcoin. This correlation is presents since the start of March. In case of a bullish breakout we can anticipate that the dynamical resistances in green will form a local top, this is the major resistances to break if we want to see 4100 sats and a possible wick to 6000 sats.
On the short term we can see that the 4 hrs is very likely anticipating a big move in the next days, I expect to see it happen Monday (26) or the next day for the break of this triangle. Meanwhile the 4hrs should hold the trend over the EMA 200, if it goes under it the likelihood for a break downward are increased. In that case 1870 sats is an important level.
ADA/BTC weekly
4Hrs ADA/BTC

Cardano (ADA) - April 23Hello?
Dear traders, nice to meet you.
By "following" you can always get new information quickly.
Please also click "Like".
Have a good day.
----------------------------------
(ADAUSD 1W chart)
(1D chart)
We have to see if we can get support and climb in the 1.15577388-1.22749797 section.
If it falls from the 0.94060159 point, a Stop Loss is needed to preserve the profit and loss.
----------------------------------
(ADABTC 1W chart)
(1D chart)
We have to see if we can get support at the 2217 Satoshi spot and climb along the uptrend line.
If it falls, we need to make sure we get support at the 2097 Satoshi spot.
-------------------------------------------------- -------------------------------------------
** All indicators are lagging indicators.
So, it's important to be aware that the indicator moves accordingly with the movement of price and volume.
Just for the sake of convenience, we are talking upside down for interpretation of the indicators.
** The wRSI_SR indicator is an indicator created by adding settings and options from the existing Stochastic RSI indicator.
Therefore, the interpretation is the same as the conventional stochastic RSI indicator. (K, D line -> R, S line)
** The OBV indicator was re-created by applying a formula to the DepthHouse Trading indicator, an indicator that oh92 disclosed. (Thank you for this.)
** Check support, resistance, and abbreviation points.
** Support or resistance is based on the closing price of the 1D chart.
** All explanations are for reference only and do not guarantee profit or loss on investment.
Explanation of abbreviations displayed on the chart
R: A point or section of resistance that requires a response to preserve profits
S-L: Stop Loss point or section
S: A point or segment that can be bought for profit generation as a support point or segment
(Short-term Stop Loss can be said to be a point where profits and losses can be preserved or additionally entered through installment transactions. It is a short-term investment perspective.)
GAP refers to the difference in prices that occurred when the stock market, CME, and BAKKT exchanges were closed because they do not trade 24 hours a day.
G1: Closing price when closed
G2: Cigar at the time of opening
(Example) Gap (G1-G2)

ADA BTC - SteadyCardano / Bitcoin seems to operate within this range.
EMA is positive against the falling bitcoin.

🚀Buying opportunity in ADAUSDT🚀❗️Conduct your own due diligence.
❗️I am not a licensed qualified investment advisor. I am an amateur investor. All the ideas, & opinions are for informational, and educational purposes only.
❗️While the information provided is believed to be accurate, it may include errors or inaccuracies.

