ADABTC


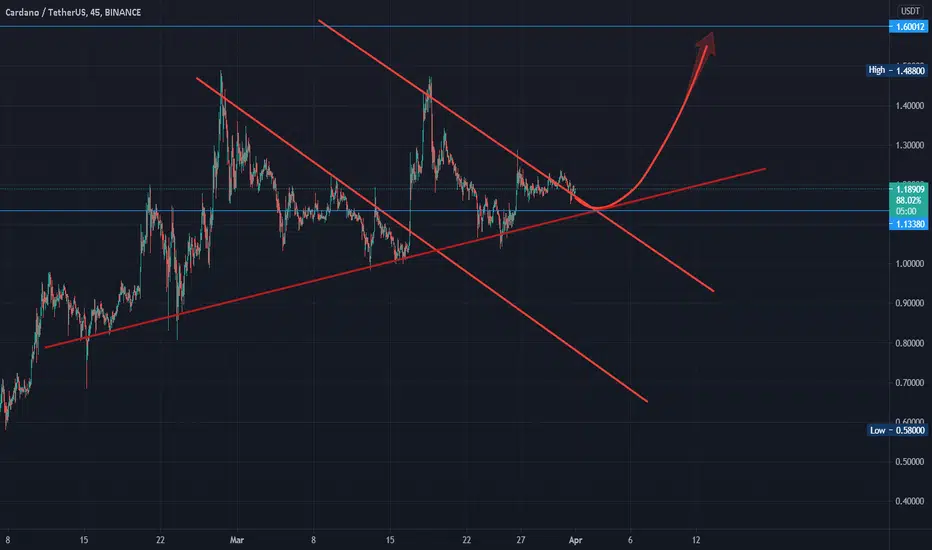
ADA - Buy Cardano before next huge pump! 🚀ADA is coin with one of the biggest mc from our golden altcoins list on long term. It is very good project, price is after little correction and it may be good time to buy. Our strategy says to buy in many parts - so If you are interested in this coin we advise to buy some now and then buy again later. Buying in many parts is perfect strategy to average the purchase price and minimize risk. However altcoins season is on and ADA can pump very soon too!
ADA holders can stake it to get free ADA on Exodus wallet and in few other places.
🚀 This coin is on our golden long-term altcoins list. It may be very good project for long term investment.
❎ No TP for long-term investments. We can`t predict exact altcoins targets in long term, but thanks to our experience and glassnode we are able to predict exact bitcoin targets. Our long-term strategy is just to hold these altcoins until glassnode indicators will say us that we are close to end of bullrun. And then we will sell everything in 15% parts.
✅ Bullrun is easy. Just accumulate coins from our golden list (long) and play with our signals (short). Diversification is the key to success.

ADA - Buy Cardano before next pump! 🚀ADA is coin with one of the biggest mc from our golden altcoins list on long term. It is very good project, price is after little correction and it may be good time to buy. Our strategy says to buy in many parts - so If you are interested in this coin we advise to buy some now and then buy again later. Buying in many parts is perfect strategy to average the purchase price and minimize risk. However altcoins season is on and ADA can pump very soon too!
ADA holders can stake it to get free ADA on Exodus wallet and in few other places.
🚀 This coin is on our golden long-term altcoins list. It may be very good project for long term investment.
❎ No TP for long-term investments. We can`t predict exact altcoins targets in long term, but thanks to our experience and glassnode we are able to predict exact bitcoin targets. Our long-term strategy is just to hold these altcoins until glassnode indicators will say us that we are close to end of bullrun. And then we will sell everything in 15% parts.
✅ Bullrun is easy. Just accumulate coins from our golden list (long) and play with our signals (short). Diversification is the key to success


ADA diamond pattern, bullishit looks like this could be a bullish diamond pattern.
not financial advice

Cardano is a Scam. Charles, come at me. $ADA #ADA #EthiopiaCardano is a scam— I strongly believe that ADA is the XRP of this bull market as it relates to cryptocurrency. Globally, they don’t pass the Howie Test. In Ethiopia, they fail to meet or submit the proper documents for purposes of the Public Procurement Agency— yet still tout their MOU signed in 2018 as an empty victory. I’m tired of hearing about vapor ware, and will not allow Charles Hoskinson and his Associate John OConnor to get away with it in Ethiopia. Over several weekends, I have been hosting rooms of roughly 100 participants in a “Blockchain Ethiopia” room on Clubhouse. I will be escalating the case further as it relates to Twitter and additional social media platforms in addition to authorities and officials in Addis Ababa. Also, for some fantastic reason, every time I open my month on Saturday, the price seems to drop 1 to 3%. It’s an hour long conversation so the minute by minute chart is pretty spot on. 15 minute intervals also works to undercover the trend.

CARDANO BOPPERSUpdates: See previous post for volume cycle analysis, continuation is expected! Comment your thoughts!

Cardano BTC and USDBitcoin pair could be interpreted in two different ways, bullish pennant or, the head of a head and shoulders pattern
THE USD pair is a quite clear bullflag,
lets see how high this goes

CARDANO: RANGE AREA OPPORTUNITY IN BULLISH TREND !!! 🔔🔔Welcome back Traders, Investors, and Community!
If you LIKE this analysis, Please support our page by hitting the LIKE 👍 button
Feel free to request any pair/instrument analysis or ask any questions in the comment section below.
Strategy : Range TRADING on BULLISH channel
Good trading at everyone!


ADAUSDT | Cardano Is Ready For Big Move!Hello, dear subscribers!
ADAUSDT ANALYSIS
Current price action for Cardano is very interesting now. We can see the upward trendline and also the price range between $1.01 and $1.45. There are 2 potential scenarios.
1.Green. The price will bounce off the trendline again to the range upper band. In this case the $1.14 acts as a support level for the potential dip buying.
2.Red. The range's lower band can also be reached. Thus, $1.01 is a nice level for the safety buy order setup.
ADABTC ANALYSIS
These two charts are related to each other we can see almost the same situation for ADABTC. If the trendline is going to be supported the green scenario for both markets can play out. The price of ADABTC drop to the support line can occur in conjunction with red scenario for ADAUSDT
DISCLAMER: Information is provided only for educational purposes. Do your own study before taking any actions or decisions.

CARDANO BOPPERS Volume cycle complete from $0.10 prices. No signal, I personally think this wave is consolidation enough to never see $1 again. To find price targets, we can use ratio's to ETH's market cap , because Cardano is definitely generations ahead in technology. ;)
ADA 38.7B - ETH 237B
At 16% the size today, $6 ADA would match todays ETH valuation.
100B will mean a roughly $3 ADA, I don't think that's far off.
Comment your thoughts or tell me about your alt-bag. Follow me for my other bets, VeChain/ Vet Bet.
Side note, love this fib.

Cardano on the move!Been drawing this ADA chart yesterday for a friend. Today 2070 resistance already tested 👍 Therefore I believe next should be 2160 and potentially we may expect wick higher to ~2300.

ADA/USD Analyse we have strong trend line which support price for 3 times but if it broke we expect to reach the support zone
you can get long order in 4th touch
i will be happy to know your idea.
more simple more useful.

ADA - History Repeating ItselfLet's hit our 3rd run on this ADA cycle! The 1H and 4H are starting to look bullish again, wish a slightly bearish 1D chart. I think we can milk a bit of profit on this ADA play as it is hitting buy territory again.
Entry: 1,950-2,050 sats
Stop Loss: 1,900 sats
Targets: 2,100 - 2,250 - 2,400 - 2,600+ sats

Cardano in 2021 vs Ripple in 2017Yet another long term chart.
Heres why I think ADA in this bull market can be what XRP was in the last cycle:
1. ADA IS , like XRP WAS, a top 5 coin
2. ADA has a lot of believers and a lot of haters. XRP was probably the most hated coin in 2017.
3. People who hate ADA are convinced it is useless (similar to XRP). Now XRP has been proved to be useless. With ADA, we don’t know.
4. XRP has seen two mega cycles, ADA has seen one.
A comparison of price action over the long time period shows ADA’s bull target should be somewhere between 7-15 USD. If you think this valuation is ridiculous, guess what? Back when ripple was worth 3 cents, a forecasted value of 30 cents was deemed to be ridiculous. XRP eventually went close to 3.4 USD.
Now you might argue that using that logic, ADA could do a 100x to 100 USD: That is highly unlikely because of the market maturing as a whole. Also there are a lot more alts that will suck liquidity.
I will not be shocked if ADA goes to 6-7 USD this year, comparing XRP’s performance in 2017, this is a conservative estimate. 15 USD is also possible. Both these levels were obtained by comparing fib levels between ADA and XRP.
Good luck!


Cardano (ADA) - April 1Hello?
Dear traders, nice to meet you.
By "following" you can always get new information quickly.
Please also ask for the "Like" clock.
Have a nice day.
----------------------------------
We have to see if we can get support and climb in the 1.15577388-1.22749797 section.
In particular, it remains to be seen if it can rise along the uptrend line.
If you go down at 1.05403273, you need a short Stop Loss.
If it falls between 0.84429438-0.94060159, a Stop Loss is required to preserve profit and loss.
It remains to be seen if the CCI line can rise on the CCI-RC indicator.
If the CCI line falls below 100 points, volatility may occur, so careful trading is necessary.
---------------------------------------
(ADABTC 1D chart)
We must see if we can quickly ascend above the 2097 Satoshi point.
If you fall from the uptrend line, you can touch the 1705 Satoshi point, so you need to trade carefully.
If it falls at 1705 Satoshi, Stop Loss is needed to preserve profit and loss.
-------------------------------------------------- -------------------------------------------
** All indicators are lagging indicators.
So, you need to be aware that the indicator moves accordingly with the movement of price and volume.
Just for convenience, we are talking upside down for interpretation of the indicators.
** The wRSI_SR indicator is an indicator created by adding settings and options from the existing Stochastic RSI indicator.
Hence, the interpretation is the same as the traditional Stochastic RSI indicator. (K, D line -> R, S line)
** The OBV indicator was re-created by applying a formula to the DepthHouse Trading indicator, an indicator that oh92 disclosed. (Thank you for this.)
** Check support, resistance, and abbreviation points.
** Support or resistance is based on the closing price of the 1D chart.
** All explanations are for reference only and do not guarantee profit or loss on investment.
Explanation of abbreviations displayed on the chart
R: A point or section of resistance that requires a response to preserve profits
S-L: Stop Loss point or section
S: A point or segment that can be bought for profit generation as a support point or segment
(Short-term Stop Loss can be said to be a point where profits and losses can be preserved or additionally entered through installment transactions. It is a short-term investment perspective.
GAP refers to the difference in prices that occurred when the stock market, CME, and BAKKT exchanges were closed because they do not trade 24 hours a day.
G1: Closing price when closed
G2: Cigar at the time of opening
(Example) Gap (G1-G2)

$10-15 ADA Fractal Target I expect alts to accelerate into hyperdrive in the coming months. The overall target that I have for the cup and handle that ada has been forming for the past 3 years is $15. GIGABULLISH.

ADAbtc - which way do we go? The support area is a no trade zone for me on this because it could go either way.
Regardless of direction, i'm looking for a break and retest with decent targets indicated.

