Cardano Analyze (12/17/2022)!!!↘️It seems that we are still not close to the end of Cardano's decline.
I expect Cardano to continue to fall to the heavy support zone, and after breaking the downtrend line, I can hope for Cardano to rise, so if you are looking to buy Cardano, you will likely see more attractive prices.
Cardano Analyze ( ADAUSDT) Timeframe Weekly⏰ (Log Scale).
Do not forget to put Stop loss for your positions (For every position you want to open).
Please follow your strategy, this is just my idea, and I will be glad to see your ideas in this post.
Please do not forget the ✅' like '✅ button 🙏😊 & Share it with your friends; thanks, and Trade safe.
ADABTC

ADAUSDT descending triangle (NEW)What we can see in the chart is the descending triangle which is a bearish pattern.
As the price is in the downtrend overall, we expect the price to break down.
Enter the position only if we get a break down with a volume surge.
It would be 40 % drop and the price would drop to approx. $0,26
Good luck

ADA targets within reachwaiting for reaction if/when we hit my blue targets which I have had on this chart for over a year .. waiting patiently ..

ADA/USD 1DAY UPDATE BY CRYPTOSANDERSHello, welcome to this ADA /USDT 1DAY chart update by CRYPTOSANDERS.
I have tried to bring the best possible outcome to this chart.
CHART ANALYSIS:-Cardano (ADA) hit an all-time low in today’s session, as sentiment in cryptocurrency markets remains bearish, following recent economic data.
ADA/USD dropped to an intraday low of $0.2845 earlier in today’s session, less than a day after trading at $0.3026.
Today’s sell-off comes as cardano fell for a third straight session, breaking out of a key support point in the process.
Looking at the chart, the aforementioned floor is at the $0.3000 mark, which was broken once before, on November 21.
The 14-day relative strength index (RSI) also moved below a floor of 35.50, and as of writing is tracking at 30.91.
This is the lowest point the index has hit since October 22, with prices hitting a bottom of $0.3100 on that occasion.
This is not a piece of financial advice.
Hit the like button if you like it and share your charts in the comments section.
Thank you

ADA is going to the lower end of the channelBINANCE:ADAUSDT has been trending on a downward bearish channel for sometime now, and it was rejected from the median line of the channel. We will likely see a continuation to the lower bound of the channel completing an ABC correction.

Cardano has broken a monthly support!Support in the range of $0.305-$0.310 was considered for Cardano, where the price is still located. Positive divergences are observed on the RSI indicator. Also, due to the formation of the horizontal zone on the Ichimoku indicator cloud, there is a possibility that the price will return from this support level. But you should note that Cardano has broken monthly support, but if it can return above the $0.35 range this month, it is more likely that the break is fake, and the price will remain at the monthly support level. Buyers' short-term resistances and targets are in the range of $0.340-0.347; the second target is in the range of $0.360-0.370 and can be short-term profit-saving ranges. Note that the first resistance is the same as the midline of the main descending channel.
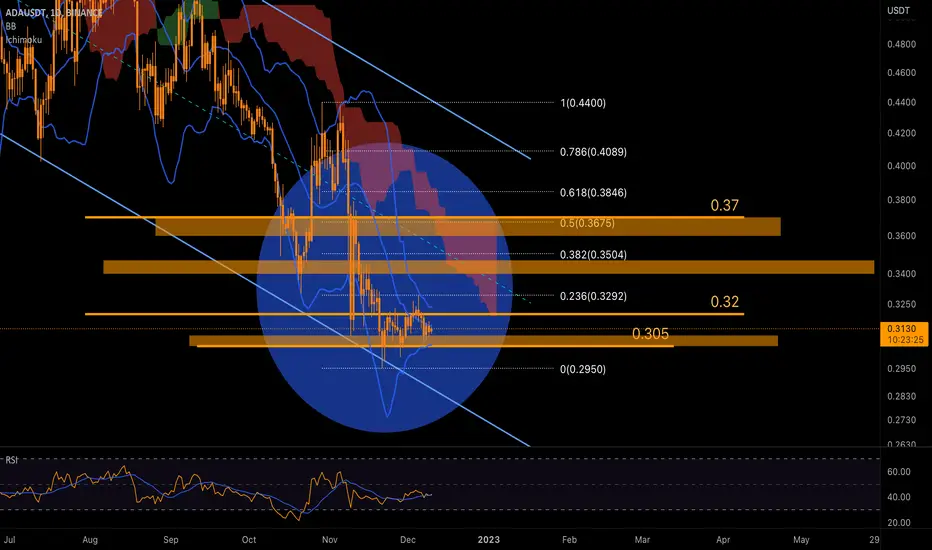
Cardano's price reacted positively to its support!ADA had a range trend during the last week. Cardano's price reacted positively to this support area after returning above the $0.305 range. But the price trend of Cardano in the 4-hour period is still a range. There is a linear resistance at $0.32, a break of which could provide a continuation of short-term upside for Cardano to the $0.340-$0.350 range. As long as the support indicated on the chart holds, Cardano has the potential to rise in price for the coming week. The $0.32 line resistance has also been associated with reaction several times.
Therefore, breaking it into the 4-hour timeframe can provide continued short-term growth. On the higher time frame, with Cardano's monthly support broken, the overall trend is bearish until the price fully returns above the $0.37 range. The RSI indicator forms positive divergences, which can signify a trend reversal, at least in the lower time frames. It should be noted that there is still a possibility of breaking the monthly support into higher timeframes. Therefore, purchases can be short-term.

ADAUSDT $36c Likely on PhoenixAscendingHi Traders, Investors and Speculators 📈📉
Ev here. Been trading crypto since 2017 and later got into stocks. I have 3 board exams on financial markets and studied economics from a top tier university for a year. Daytime job - Math Teacher. 👩🏫
Here's a short term overview on what we can expect for the price of Cardano for the immediate term. Technical indicator Phoenix Ascending together with Bollinger Bands point towards a potential $0.36c, as we see the RSI and EMA moving up with bullish buying momentum in the short term. IF the green EMA can cross over the 50 line, we can expect movement towards the basis of the bollinger bands, even if it is just a wick. The basis is the 20d moving average currently at $0.36.
However, currently with all the bankruptcy happening in the crypto environment, the markets do not look favorable for a new bull cycle, so I expect a resistance zone here. The next immanent support zone is around 0.22c, where there is a high demand zone and this is where I expect a bottom for ADAUSDT to be found.
Curious about what Decembers hold for Bitcoin historically? Check out this idea:
_______________________
📢Follow us here on TradingView for daily updates and trade ideas on crypto , stocks and commodities 💎Hit like & Follow 👍
We thank you for your support !
CryptoCheck

The point to break out of the downtrend is...Hello?
Traders, welcome.
If you "Follow", you can always get new information quickly.
Please also click "Boost".
Have a good day.
-------------------------------------
(ADABTC 1W chart)
If supported in the 0.0000 1593 ~ 0.0000 1944 section, it is expected to gather the power of the rise.
If this is not the case and falls below 0.0000 1593, the uptrend is expected to drop sharply.
---------------------------------------
(ADAUSDT 1W Chart)
The key question is whether it can rise to the 0.5184-0.6834 range.
To do so, we need to hold the price above 0.2772 and see if it can rise.
(1D chart)
The key is whether the price can sustain the move above 0.3321 to break out of the downtrend channel.
Once it breaks out of the downtrend channel, we need to see if it moves above 0.3974 and prepares to continue the uptrend.
If it does not, and it falls below 0.2772, there is a possibility of entering long-term investment territory, so you need to think about how to respond.
The next period of volatility is around December 5th.
-------------------------------------------------- -------------------------------------------
** All descriptions are for reference only and do not guarantee profit or loss in investment.
** If you share this chart, you can use the indicators normally.
** The MRHAB-T indicator includes indicators that indicate points of support and resistance.
** SR_R_C indicators are displayed as StochRSI (line), RSI (columns), and CCI (bgcolor).
** The CCI indicator is displayed in the overbought section (CCI > +100) and oversold section (CCI < -100).
(Short-term Stop Loss can be said to be a point where profit or loss can be preserved or additional entry can be made by split trading. This is a short-term investment perspective.)
---------------------------------

ADABTC Weekly Timeframe. Are the bulls coming back? Are the bulls coming back into ADA as we retrace and find a bottom at the .78 Fibs?
For more information visit - www.facebook.com


Mid-term bearish channel!ADA has hit the bottom of its mid-term bearish channel at $0.30 over the past week after continuing its downward trend, and with a market-wide pullback, Cardano has also been supported, giving it a 7% gain. The bottom line is that mid-term and long-term sellers' strength is still high, and price reaction to resistance levels is still possible. In the 4-hour time frame, there is a past resistance for Cardano, which is in the $0.340-$0.350 range.
Until this level is broken, the short-term trend cannot be bullish. But the price growth can continue up to the range of $0.345. After that, there is a possibility that the price will enter a range area in the 4-hour time frame. If Cardano breaks the resistance of the $0.370 range, it can grow up to the ceiling of the descending channel at the price of $0.420 to $0.440.

ADAUSDT: Is It the Best Time to Buy ADA? 🫣| Nov. 25, 2022
This week, we will stick to the 4-hour time frame to analyze the price action in detail!
The bears clearly have had a tight grip on the bulls for the past few weeks as seen in the chart above. ADA has been continuously hitting 52-week lows, the recent one being hit on Monday.
Until we see the price reverse, it is risky to take a long position on ADA. Therefore, traders should avoid taking positions until ADA is able to reclaim the resistance at $0.34.
The price will show signs of strength only once it is able to sustain above $0.34. Until then, there is a chance of a new 52-week low being hit!
Once the resistance is reclaimed, we can expect the price to start approaching our short-term target marked on the chart at $0.38. This view will only be valid if the price is able to sustain above $0.34. We will maintain a bearish outlook on ADA until it is able to reclaim the resistance.
The important price levels for this week are $0.34 and $0.38!

ADA 15 min short IDEAI've illustrated on the chart, exactly how I see ADA short playing out, however ton of overhead to get through, let me know your thoughts. Does this make sense, happy to discuss!

Cardano non popular chart 💔Update:
Cardano non popular chart 💔
I HODL ADA for long-term
Looking on weekly chart without emotion and bias...
ADA might correct🔻much lower dear Crypto Nation
Even $0.095 or $0.053 would not be the end of future price gains - just Log-Fib
Let me know your thoughts in the comments🤗
⬇️⬇️⬇️
Likes and Follow for updates appreciated🤗
Disclaimer:
Not financial advice
Do your own research before investing
The content shared is for educational purposes only and is my personal opinion

Cardano (ADA) - November 22Hello?
Traders, welcome.
If you "Follow", you can always get new information quickly.
Please also click "Boost".
Have a good day.
-------------------------------------
(ADABTC 1W chart)
If the price stays in the 0.0000 1593 to 0.0000 1944 range or above, it can be interpreted that an upward force exists.
However, since the volume profile section is formed over the 0.0000 2147 ~ 0.0000 2982 section, it is expected that there will be restrictions on the rise until this section is exceeded.
-----------------------------------------
(ADAUSDT 1W Chart)
The key question is whether it can rise to the 0.5184-0.6834 range.
To do so, we need to see if we can sustain the price by moving above 0.3321.
(1D chart)
It is the most important section from the current position, the 0.5184-0.6834 section, and the key is whether it can be supported by rising to this section.
To do so, it must rise from a falling channel.
The point at which it can be considered to have risen from the downtrend is when it rises above 0.3621 and maintains the price.
If it breaks out of the downtrend channel, it should find support near 0.2772 and rise.
If not, you'll most likely be entering the realm of long-term investing, so be cautious.
Finding what's most important at where the current price is located is the first step in creating a trading strategy.
The key points in the current price range are 0.2772 and 0.3621.
From a mid- to long-term perspective, the 0.5184-0.6834 range is the key range.
-------------------------------------------------- -------------------------------------------
** All descriptions are for reference only and do not guarantee profit or loss in investment.
** If you share this chart, you can use the indicators normally.
** The MRHAB-T indicator includes indicators that indicate points of support and resistance.
** SR_R_C indicators are displayed as StochRSI (line), RSI (columns), and CCI (bgcolor).
** The CCI indicator is displayed in the overbought section (CCI > +100) and oversold section (CCI < -100).
(Short-term Stop Loss can be said to be a point where profit or loss can be preserved or additional entry can be made by split trading. This is a short-term investment perspective.)
---------------------------------

Strength of buyers!ADA continued its downward trend without the strength of buyers. The price of this currency, which has penetrated a very important support range, has stopped at the range of 0.32 to 0.30 dollars with positive reactions. If Bitcoin does not have a heavier fall and at least continues its range trend, there is a possibility of Cardano price growth and moving toward the $0.35 resistance. But for further growth, special support from buyers is needed. Because the condition for the upward trend in the 1-hour time frame to break this resistance. The current range is at the bottom of the medium-term descending channel.
Therefore, if this support is broken in the bearish scenario, a stronger bearish wave can be formed, the first support of which is in the range of $0.22 to $0.23, and the second support is in the range of $0.17 to $0.18, and the price of Cardano only if This range meets the formation of a heavier downward wave than the previous wave in the market. But the thing about this support is that considering that there have been good reactions in this range in the past, there is a high potential for a strong positive reaction in this range.

ADABTC can drop hard if the 1W MA200 is compromised1W chart representing the ADABTC pair on the current and previous Cycle. There is a clear Resistance and Support Zone and based on where the Stoch RSI is following the 1W MA50 (blue) rejection, we are expecting a strong drop if the weekly closes below the 1W MA200 (orange). If it is unrealistic to expect ADA to lose so much ground and revisit the Support Zone, then based on the Fibonacci levels, we can aim at the -0.13 extension (0.000009).
## If you like our free content follow our profile to get more daily ideas. ##
## Comments and likes are greatly appreciated. ##
## Also DONATIONS through TradingView coins help our cause of increasing the daily ideas put here for free and reach out more traders like you. ##

CarDano ADA/USDT Again as I have mentioned earlier.. We are very close..Final capitulation is necessary to spring the crypto back up. At least we're looking for a local bottom.

CHECK ADA AMAZING WAVESThis is Cardano currency wave analysis. The explanation that goes will continue to be reformed.

ADABTCHello Crypto Lovers,
Mars Signals team wishes you high profits.
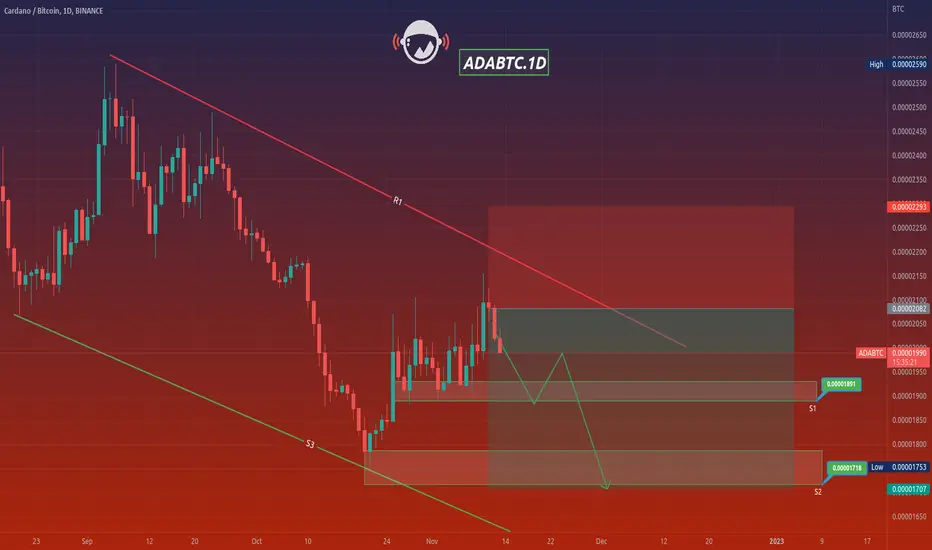
This is a one-day-time frame analysis for ADABTC
Based on our last analysis on November 1, we expected a rising trend to happen and our prediction came true in the current chart. Here we have R1 as our resistance area that has the disability of price to rise. And S1, S2, and S3 are the support areas which all express the well support of price at different points. Therefore, we have the fluctuation of price below R1 and we predict a falling trend to happen for it toward S1 and by experiencing a recovery trend, again another decline is waiting for the price down to some lower amounts. Remember that our analyses are providing you several information and details in order to help you have logical trades with proper profits. So please keep moving with us and support us.
Warning: This is just a suggestion and we do not guarantee profits. We advise you to analyze the chart before opening any positions.
Wish you luck
A positive divergence is observed on the RSI indicator!ADA experienced a sharp decline over the past week as selling pressure increased, falling from the $0.41-$0.43 resistance range straight to the bottom of its medium-term descending channel. The support associated with a positive reaction and related to the monthly time frame ranges from $0.30 to $0.35. A strong reversal with a 16% positive candle from this area could be a good sign for Cardano. So if we don't have more price drops, Cardano has good price growth potential from this support area.
Of course, the price is still at the bottom of the channel, and the potential to enter a range trend to reduce selling pressure is high. For this reason, minor support is considered in the range of $0.335-$0.340, and as long as this area is maintained, Cardano price growth is possible. A positive divergence is observed on the RSI indicator. Therefore, the potential for price growth will exist if the market conditions are maintained. With a low probability, if the current support is broken, the decline could continue to $0.22-$0.23.

Cardano (ADA) - November 8Hello?
Welcome, traders.
By "following", you can always get new information quickly.
Please also click "Boost".
Have a good day.
-------------------------------------
(ADAUSDT 1W chart)
The key is whether you can climb to the 0.5184-0.6834 section.
(1D chart)
The HA-High indicator is forming near 0.3974, so we need to see if we can find support and move up around 0.3974.
If not, there is a possibility that it will fall to around 0.3621.
The interval 0.5184-0.6834 is the interval that determines the trend.
Approaching this section can make you feel like you're going to skyrocket and you might end up buying.
Therefore, it is advisable to decide whether to buy or not buy this coin before it rises above 0.4380.
This is because you may end up buying at a high point.
------------------------------------------------------------ -------------------------------------------
** All descriptions are for reference only and do not guarantee a profit or loss in investment.
** If you share this chart, you can use the indicators normally.
** The MRHAB-T indicator contains indicators that indicate support and resistance points.
** SR_R_C indicators are displayed as StochRSI(line), RSI(columns), CCI(bgcolor).
** CCI indicator is expressed as overbought range (CCI > +100) and oversold range (CCI < -100).
(Short-term Stop Loss can be said to be a point where profit and loss can be preserved or additional entry can be made through split trading. It is a short-term investment perspective.)
---------------------------------
