Cardano 2 flexible directions (LONG).I have established this analysis on the occasion that we are in a sideways trend.
We can process the side-by-side theory / trend by analyzing breakouts, up-
downtrends, support and recistance, etc.
Therefore, I have deputed 2 'bullish' options or channels, I think initiate themselves as, the two solutions a higher 'bull-run' should be constructed after. Thanks!
Adalong

ADA ready for a BreakoutBreaking away from the previous wedge we may see a pullback retest, do a Touch & Go off of the resistance then test out $1.70+ resistance. From there we'll see a slight pullback before continuing on a nice Bull run.
If we do fall below this resistance we may see a Consolidation Phase moving through the weekend into the weekend.
With Smart Contracts coming up, I believe the market is fixing to get very Bullish.

ADA [LONG]As per my other charts - LONG on ADA being loading up during the recent weeks.
Looking at indicators there is a potential for a small pullback before we move forward (same for BTC, LINK, ETH). Would be a good add-on spot IMO before we move north of $1.30.
** NOT TRADING OR FINANCIAL ADVICE **

ADA's Target if Falling Wedge is BrokenIf ADA is able to successfully break the falling wedge resistance we're looking at a huge target at approximately $2.02.
There will definitely be resistance along the way, so I've drawn out the potential scenarios and resistance lines that could impact the price action on the way up.

Cardano is on Fire!🔥⚡ #ADA $ADAIt can be said that most of the crypto market coins are ready to explode, but all eyes are on bitcoin. There are three goals for Cardano in the diagram, all three of which are resistance.
Currently, due to the increase in the bitcoin range and its movements, all altcoins will be affected by it. The analysis is just a series of probabilities.
I hope you find this analysis useful🌹
Follow for more...

ADA massive drop is coming 😲finally we're going to break a super strong support on $1. I think a 30-40 day swing between $0.5 and $1 (until the big Cardano update) is a good time to buy dip before huge uprise.

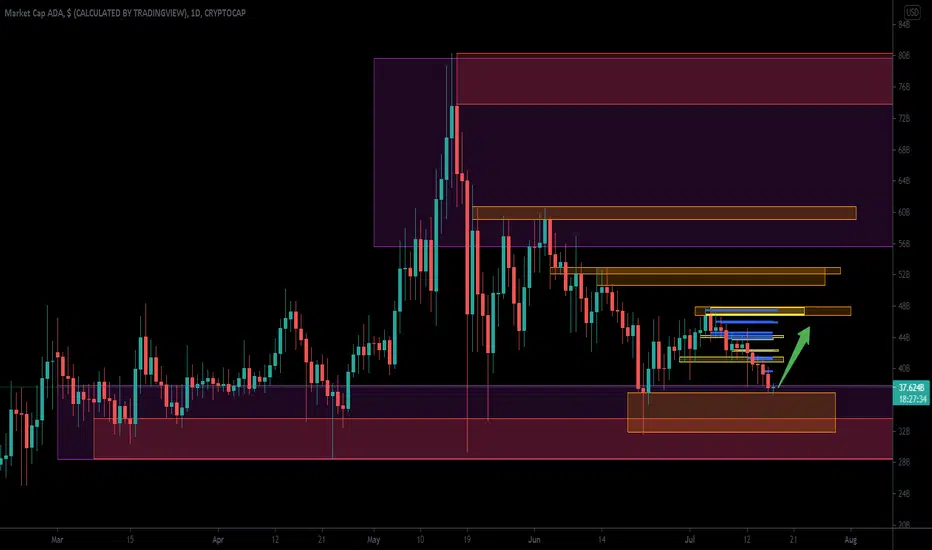
Cardano (ADA) Multi time frame analysis, Crypto Trading Idea #4Purple Zones = Monthly SNR
Red Zones = Weekly SNR
Orange Zones = Daily SNR
Yellow Zones = 4 Hour SNR
Blue Lines = 1 Hour SNR
Cardano (ADA) close above Daily Support and it is on Monthly support zone too and can go up from this level but this depend on fundamental analysis about Cardano too. I also draw SNRs on 4 hour and 1 hour chart that can be easily follow the new uptrend
If this help you with your trading Please Like, Share and Follow that give me motivation to make another Trading Ideas
If you have some suggestion, comment or other opinion feel free to write it in comment
Wish you succesfull and consistent trading with profits!

Cardano (ADA) (Long)Placing some low leveraged Buy orders at these support Zones. Should retract at least 20% once price hits these Zones...

ADA LONGVery bullish on ADA and have been DCAing in - looking at adding on as per the chart at key pullback points.
Watching wider market and prepared for major pullbacks as charted too.
** NOT FINANCIAL ADVICE **


BUY AREA CARDANO (ADA) - ASCENDING TRIANGLE PATTERNBUY AREA CARDANO (ADA) - ASCENDING TRIANGLE PATTERN

ADAUSDT(1H CHART) Head and Shoulder PatternADAUSDT(1H CHART) Technical Analysis Update
ADAUSDT(1H CHART) currently trading at $1.346
Buy-level: Above $1.352
Stop loss: Below $1.234
Target 1: $1.395
Target 2: $1.456
Target 3: $1.585
Max Leverage: 3X
ALWAYS KEEP STOP LOSS...
Follow Our Tradingview Account for More Technical Analysis Updates, | Like, Share and Comment Your thoughts.


ADA > Trendline..will go upHi friends,
I think ADA will go up after restest to the trendline.
**feel free to correct me or share your views in the comments.

Cardano (ADA) analysisCardano is the strongest coin in this bear market. both technical and fundamental say we may see a huge pump in the near future. Buy and stake BINANCE:ADAUSDT

ADA USDT BUY AND SELL POSITIONThe blue and green range is suitable for buy
Your own risk
Do not forget to like and comment


CARDANO Trendline Breakout Long Trade to $1.50Cardano has been trading under an extended resistance trendline that has kept prices down. It has just formed a bullish RSI divergence on the 1H timeframe, suggesting that bearish momentum could be taking a pause. If price is able to break above the resistance trendline at 1.42, we can see a rally to the critical $1.50 level. The 1.50 is an important level for Cardano as it has served as support and resistance multiple times.
Hi guys, this is OG back with another cryptocurrency update. If you find value in my work, please do like, share, and comment. And also feel free to share your ideas and technical analysis in the comments below.
Check out my technical analysis videos for more in-depth analysis and trade setups for Bitcoin, Ethereum, and Altcoins.
Why follow?
1. Community of Technical Analysts sharing analysis and trades
2. Live tracking of whale wallet movements
3. Live update of the latest important news
4. Live syncing of popular crypto tweets
5. Ebook covering how to be profitable in the cryptocurrency market
As always, I’m not a financial advisor, all information presented is for educational purposes only and not meant as financial or investment advice, do your own research, and stay safe!


ADA/USDT triangleADAUSDT
If you look closely at the triangle I took, you will see that
The desire to climb is greater because each time the insole is higher
Formed from its previous floor and to enter from the servant's point of view
Above the price of 1.6840, it can be a good option, provided that
Have risk and capital management
