XRP/BTC Adam & Eve Reversal?We could be looking at a Ripple reversal here with a nicely formed Adam & Eve pattern into the 4H cloud. A tenkan-kijun cross here would also help confirm this bullish reversal, so watch for that.
Conservative target rests at 2150 using the flat top of the cloud, with a more ambitious target of 3150 through the support/resistance zone of 2500-2900.
Adam

Daily Adam and Eve may project price target of 410Daily Adam and Eve may project price target of 410
thepatternsite.com
Criticism and notes welcome.

REP Going to Breakout?Adam and Eve + Breakout. Details in chart. I'm still new to this so go easy on me :P

Classic Eve followed by Adam double top..Will the neckline be tested?
lol, if textbook back the truck up at high 2ks..

ETH Ascending Wedge quick rally before resuming correctionLooks like a quickly rally following the bearish Adam and Eve formation, expecting to hit 320-330 before resuming correction toward support at ~285
www.tradingview.com

Buying ETCETC appears to have made an adam and Eve bottom and up into a bullish pennant with a bull div and descending volume pattern.
The measured move from the Adam bottom, the flat cloud, and 50% retrace from the all time high all point to a little over $16 as the classical target for this move before a correction.
For a safer entry, wait for a close above the cloud on volume.

ETH Adam & Eve: Another LookHere's another look at those Adam & Eve fractals on $ETH. In addition to the 12HR candle patterns being nearly identical, the MA Exp Ribbon's (lots of EMA lines) behavior appears to be basically exactly the same too. We could be looking at a hard drive to 500 and beyond.
– @BrightGoldCrab


ANS short term trade, looking bullishNeo/antshares looks like it wants to go antoher leg up. Not that much time left before 8.aug.
This is just a swing trade, you can also hodl ans/neo and become rich
buy my bags
t1-55-6
t2- 7-75

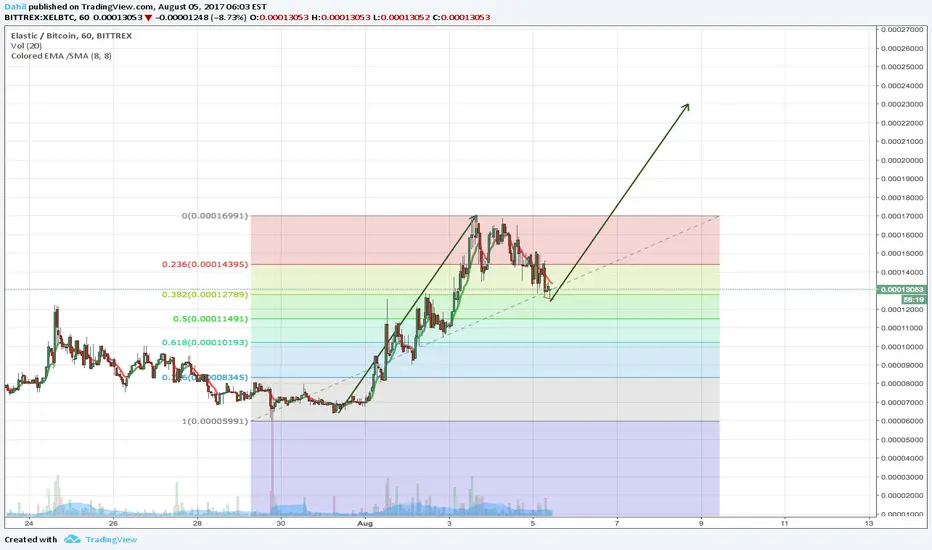
Elastic Double button in (reversal) Target (20-23)kbeautiful "bull flag", nice buy support, low sell side and low rsi. All of these tells me that we are in for the next wave up.
Be careful if bitcoin explodes :)
Buy my bags pls
LTC BTC ratio in for a spike? Neutral until Eve formsThe litecoin bitcoin ratio has held strong during bitcoins rise.
A potential Adam and Eve formation could see LTC dropping to the 0.0125 range, signalling a local bottom.
Get long if Eve forms

USO - Adam Smith Moving Average Cross StrategySimple Moving Average strategy for USO - United States Oil Fund. This strategy can be used on stocks and currencies but will need to tweak frequency on chart and backtest Max Draw Down to Net Profit ratios for maximum dollar gains.

Adam Smith - Moving Average Cross StrategyThis can be backtested using stocks and currencies. For stocks, depending on which stock and its voltility, backtest shorter chart frequencies such as 3min to 1hr. For currencies, backtest longer chart frequencies such as daily to month depending on backtest you see fit. A quick note such as USDJPY, a week is sufficient for example. You will see high Net Profit and low Max Draw Down. However, do backtest for insurance.
A key indicator is the Max Draw Downs. Make sure you compare how much the backtest recognizes to indicate how much money will be estimated or required during the bad times and/or bearish times.

Adam Smith Strategy - MACD ModifiedDetects when to long and short items based on algo-MACD strategy created by Adam Smih.

1 setpember : Kebab Oil Unlimited : Usoil : Adam & Eve pattern Kebab Oil Unlimited, is on penny, once a day joke , lead on oil strategist lol
proposes you next trading strategy on us oil ;) inverted Adam and Eve , oh good L... ;)
we need to confirm new support 46.47 and if so we are back to 39 with inverted Adam et eve pattern , Eve & Adam confirmation ;) , and fibo 0.5 39.27 TP 1
and then C point at 36.87 TP 2
thepatternsite.com
Kebab Oil Unlimited ;)


GOLD Eve and Adam Reversal Pattern on 1HFX:XAUUSD
A perfect example of the Eve and Adam reversal pattern here. Expect to make a sure profit selling it to a conservative take profit level near one of the daily fibonacci levels.

