LTC Wakes Up — Bullish Adam & Eve Targets $150+LTC is gaining serious momentum, breaking through key resistance levels and printing a clean Adam & Eve bullish reversal pattern. The breakout signals a potential shift in the macro trend — and the chart is offering clear setups.
✅ Breakout Through $100 & Pattern Confirmation
LTC confirmed the Adam & Eve double bottom with a breakout above $100, a major psychological resistance.
The neckline retest around $105 acted as a Market Structure Shift (MSS) confirmation, with upside wicks signaling strong demand and a reversal.
$100–$105 Support Zone: Stacked Confluence
This zone offered a high-probability long setup due to multiple overlapping technical factors:
Yearly Open (via DriftLine - Pivot Open Zones ): $103.28
0.382 Fib Retracement: $104.67 (from $76.17 low to $122.29 high)
Anchored VWAP from the $76.17 low
POC of 1-Year Trading Range: ~$102
233 EMA & SMA (4H TF): Both moving averages aligned between $103–$100, acting as dynamic support
✍️ A clean, high-confluence demand zone between $100–$105 — ideal for long setups.
Upside Structure & Next Long Opportunity
➡️ Current Price: ~$127
A fresh long setup may present itself around $120 on a pullback
➡️ Pattern Target: $150
🌀 1.0 TBFE: $149.28
🌀 1.618 TBFE: $147.31
🔺 Key Swing High / Liquidity Pool (BSL): $147–$150 — an area to watch for possible rejection
🔴 Short Setup Consideration
➡️ Short zone: $147–$151
Only short on clear confirmation: SFPs, rejections, or bearish order flow
➡️ Downside target: $135 (1:2 R:R potential)
Macro Bullish Target: $198–$200
If LTC breaks and holds above $150, the next macro target becomes:
🌀 0.618 Fib Retracement (from $295.7 high to $40.3 low): $198.14
$200 Psychological Resistance: Major round number, likely to act as magnet and profit-taking zone
🛠 Indicators Used:
DriftLine — Pivot Open Zones
↳ For key levels like the Yearly Open, crucial in confluence stacking
📚 Educational Insight: Understanding the Adam & Eve Pattern
The Adam & Eve pattern is a classic bullish reversal formation that often marks the end of a downtrend or a major correction phase.
Adam forms first: a sharp, V-shaped low — often panic-driven or capitulation.
Eve follows: a rounded, more gradual bottom, showing accumulation and stabilisation.
Once price breaks above the neckline, the pattern is considered confirmed.
A retest of the neckline (like LTC at ~$105) is often the best entry point, especially when supported by confluence like Fib levels, VWAP, or key levels.
In LTC’s case, the breakout above $100 and successful retest at $100–$105 validates the pattern — with a measured move pointing toward $150, and a macro Fib target at $198.14 aligning with the $200 psychological level.
Summary:
With a confirmed breakout, strong technical confluence, and clearly defined targets, LTC is setting up for continuation. Watch $120 for long entries and monitor $150 for potential rejection.
_________________________________
💬 If you found this helpful, drop a like and comment!
Adamandeve

This is why I firmly believe we'll witness BTC reach 150K soon.No caption needed and every reasons are kept in the chart. Zoom In and analyze every single lines in the chart and hope you will see what I tend to see as far as my capabilities allows me. Let me know your comments on the idea. I am looking forward to witness $150K in the next 3 to 4 months time. I will be updating my confluences to say this on higher timeframes too.
With Regards. And stay Tuned.

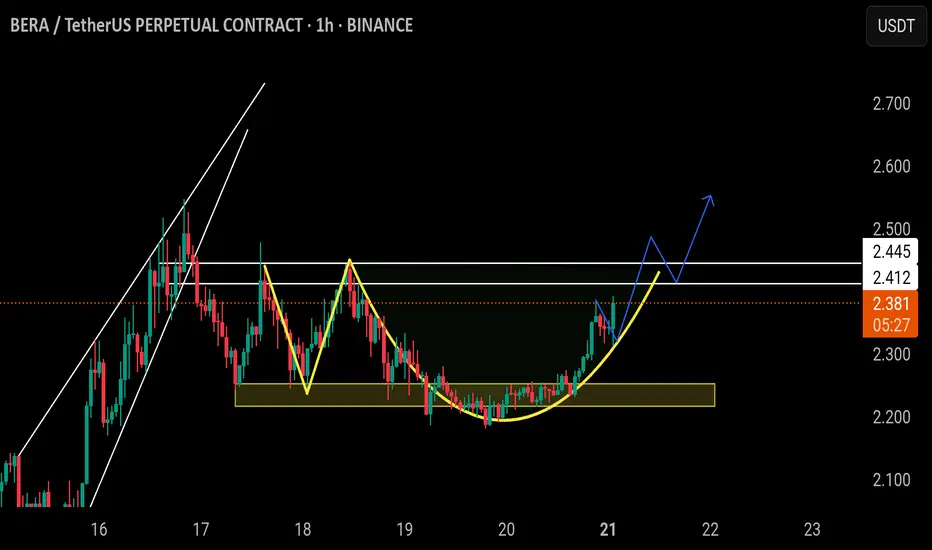
$BERA/USDT | READY TO FLY (ADAM AMD EVE PATTERN)BINANCE:BERAUSDT.P
$Bera/Usdt
The price is forming Adam and even pattern, if the price able the break above the white lines resistance, following a successful retest, the price will go higher and higher.
Aggressive entry at Current market price.
Safe entry after the breakout of white lines resistance following a successful retest of the white lines.
NFA DYOR
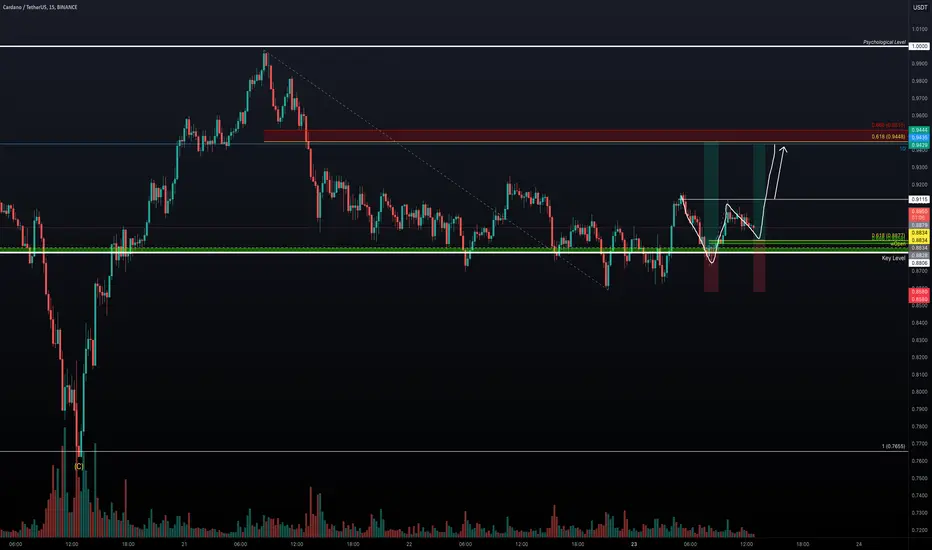
ADA - Gearing Up for a Breakout?After an impressive rebound from the trend-based Fibonacci extension 1:1 at $0.7655, ADA has been consolidating between $0.92 and $0.85 for the past two days. As the new week begins, today's wOpen at $0.8834 is a critical support level, perfectly aligning with the key level at $0.8806. Holding above these levels reinforces a bullish outlook.
Key Insights and Trade Setups:
Support Zones to Watch:
$0.8834 (wOpen) and $0.8806 (Key Level).
Maintaining above these levels keeps the bullish structure intact.
Long Setup Options:
A great long opportunity was from today’s wOpen ($0.8834).
Alternatively, wait for a retracement to the golden pocket at $0.8877 of this current wave.
R:R: 2.5, a solid potential reward for the risk taken.
Target for Long Trades:
Aim for the Fibonacci 0.618 level at $0.9448, which aligns with the daily resistance level.
This zone also represents a high-liquidity area where short sellers may be forced to exit positions.
Pattern Confirmation:
The potential formation of an Adam and Eve pattern strengthens the bullish case. Confirmation comes above $0.9155, suggesting further upside.
How to Adam & Eve PatternEver wondered about Adam and Eve in trading? It's a straightforward and powerful pattern.
Hello dear traders! If you like my graphics, please use Like button 💙💛
Picture Adam as the first market peak or dip, and Eve as the second, forming a U-shape. This pattern highlights a robust price level, suggesting a potential market shift.
How to Utilize It?
In a downtrend, spot Adam and Eve as double bottoms. When Eve follows Adam, indicating a strong support level, consider entering trades. Trade when the price breaks above resistance line, with a stop loss set at the neckline level.
Pay attention to trading volumes. They confirm buying or selling strength, offering a clear signal for a trend reversal.
Finding Your Target:
Identify the pattern's height from the neckline to the peak of Eve. Project this distance downward from the breakout point for a bullish pattern or upward for a bearish one. This gives you a potential target for your trade.
Here is an example of Adam & Eve pattern play on Bitcoin chart:
Master the Adam and Eve pattern to make confident trading decisions. It's an intuitive way to identify market change in trend and make strategic moves. 📈✨


MKR FORMING ADAM AND EVE PATTERNBINANCE:MKRUSDT forming an Adam and Eve or a double bottom, indicating a bullish pattern. Currently approaching on the neckline more details on the idea threads below. Stay tuned for updates.

SOL - Adam & Eve Double Bottom Confirming Overall performance rank (1 is best): 17 out of 39
Break even failure rate: 12%
Average rise: 43%
Throwback rate: 67%
Percentage meeting price target: 69%
The Adam & Eve double bottom pattern is a bullish reversal pattern that has been identified on the SOL Intraday price charts. Initially, SOL experienced a sharp decline from $180 to $155, forming the 'Adam' part of the pattern. This was followed by a more gradual, rounded decline over the next 10 days, forming the 'Eve' part of the pattern. This pattern suggests a potential reversal from the previous downtrend.
Potential Market Implications
The resistance level at $155 is pivotal for SOL's short-term price movement. A breakout above this level could confirm the bullish reversal indicated by the Adam & Eve pattern, potentially leading to a price target of $186. Statistical analysis suggests a 69% probability of reaching this target upon successful breakout.
Strategic Considerations
Investors and traders should consider the breakout above the $155 resistance level as a key signal for potential entry. It is advisable to wait for confirmation of the breakout before making any trading decisions. As always, it is important to consider other market factors and conduct a comprehensive analysis before entering any positions.
Adam & Eve Trading Tips
1. Measure Rule Calculation:
- Identify the highest peak (A) and the lowest valley (B) within the Adam & Eve double bottom pattern.
- Calculate the height difference between point A and B.
- Multiply this height by the 'percentage meeting price target.'
- Add the result to the breakout price at point A to determine the price target (C).
2. Price Reversal Requirement:
- Ensure there's a significant decline leading to the double bottom; minor declines typically result in minor rises.
3. Big W Pattern:
- Favor double bottom patterns with a steep, tall left side (Adam) and minimal price consolidations during the decline.
- Anticipate the price to rebound close to the level where the downtrend initiated.
4. Confirmation Necessity:
- Wait for the price to close above the peak between the two bottoms for confirmation.
- Without confirmation, there's a 48% chance the price will continue to decline.
5. Handle Formation:
- After confirmation, watch for price fluctuations forming a 'handle.'
- A breakout from this handle typically signals a strong upward trend.
6. Flat Base Indicator:
- A significant rise is likely if the double bottom follows a long, flat base.
- Use weekly charts to identify the flat base, resembling a pothole on a road.
7. Trend Impact:
- Double bottoms following a short-term decline tend to perform best post-breakout.
8. Proximity to Yearly High:
- Patterns showing breakouts within a third of the yearly high exhibit the best performance.
9. Volume Trend:
- A declining volume trend leading up to the breakout suggests favorable post-breakout performance.
10. Throwbacks Warning:
- Be cautious of throwbacks after the breakout, as they can negatively impact post-breakout performance.
Conclusion
The Adam & Eve double bottom pattern observed on the SOL chart indicates a potential bullish reversal. The upcoming resistance level at $155 is critical, and a breakout above this level could signal a significant upward movement for SOL. Investors and traders should monitor these developments closely and plan their strategies accordingly.
---------------------------------------------------------

Bitcoin On The Way To 180K!!!Hi.
COINEX:BTCUSDT
😊Today, I want to analyze BTC for you in a WEEKLY time frame so that we can have a Mid-term view of BTC regarding the technical analysis. (Please ✌️respectfully✌️share if you have a different opinion from me or other analysts).
➡️As you can see, BTC is completed this pattern, and if it follows this pattern Price can grow a lot.
✅ Due to the Ascending structure of the chart...
- High potential areas are clear in the chart.
-BTC has been Bullish Recently!
-The odds of another Bullish Movement is High!
-Bullish Pattern is Visible on The chart!
-AB=CD
Stay awesome my friends.
_ _ _ _ _ _ _ _ _ _ _ _ _ _ _ _ _ _ _ _ _ _ _ _ _ _ _ _ _ _ _ _ _
✅Thank you, and for more ideas, hit ❤️Like❤️ and 🌟Follow🌟!
⚠️Things can change...
The markets are always changing and even with all these signals, the market changes tend to be strong and fast!!

Bitcoin`s Dangerous Formation !!!BTC goes to Reverse Adam-Eve formation in 4 hours Logaritmic Chart. If the formation will complete and work the target price will be arround 50,500 Usdt.

ANKR can ascend further ! What Shall we Expect ?Hi.
BINANCE:ANKRUSDT
✅Today, I want to analyze ANKR for you in a WEEKLY time frame so that we can have a mid-term view of ANKR regarding the technical analysis. (Please ✌️respectfully✌️share if you have a different opinion from me or other analysts).
We have a Bullish Structure here:
Adam & Eve pattern is completed and broken.
Looking for a breakout and rally📈
✅ Due to the Ascending structure of the chart...
🟢 High potential areas are clear in the chart.
🟢 Adam & Eve pattern.
🟢 AB=CD.
Stay awesome my friends.
_ _ _ _ _ _ _ _ _ _ _ _ _ _ _ _ _ _ _ _ _ _ _ _ _ _ _ _ _ _ _ _ _
✅Thank you, and for more ideas, hit ❤️Like❤️ and 🌟Follow🌟!
⚠️Things can change...
The markets are always changing and even with all these signals, the market changes tend to be strong and fast!!

FILECOIN can ascend further ! What Shall we Expect ?Hi.
COINEX:FILUSDT
✅Today, I want to analyze FIL for you in a 3D time frame so that we can have a mid-term view of FIL regarding the technical analysis. (Please ✌️respectfully✌️share if you have a different opinion from me or other analysts).
We have a Bullish Structure here
Adam & Eve pattern is completed and now we testing the resistance cluster of Descending Resistance + A&E neckline + 11$ Key Zone☝️
Looking for a breakout and rally📈
✅ Due to the Ascending structure of the chart...
🟢 High potential areas are clear in the chart.
🟢 Adam & Eve pattern.
🟢 AB=CD.
🟢679 Days of accumulating inside of Adam & Eve.
Stay awesome my friends.
_ _ _ _ _ _ _ _ _ _ _ _ _ _ _ _ _ _ _ _ _ _ _ _ _ _ _ _ _ _ _ _ _
✅Thank you, and for more ideas, hit ❤️Like❤️ and 🌟Follow🌟!
⚠️Things can change.. .
The markets are always changing and even with all these signals, the market changes tend to be strong and fast!!

Uniswap triggering an Adam & Eve Double bottom inside another 1We can see here on the weekly how UNIUSd has formed a nice Adam & Eve double bottom (illustrated in the yellowish chartreuse color). We can also see how inside that double bottom we have formed a smaller fractal version of the Adam & Eve double bottom as well (shown here illustrated in pink). To make sure I covered all bases, I also included a the more common horizontal double bottom possibility as well shown here illustrated in a light grayish blue color. First and foremost the pink Adam & eve fractal has already validated its breakout and in doing so has brought us above the neckline of the largest double bottom pattern as well. I get the feeling that all 3 of these overlapping double bottom patterns are valid and will be validated. If so I will keep you updated as each of the 3 targets get hit. *not financial advice*

XLM ADAM AND EVE PATTERN: FULL CHART ANALYSIS.In this post, I'll tackle the pattern formed on BINANCE:XLMUSDT which is a bullish pattern, Adam and Eve. As of this writing, the price already reached the neckline, which is critical for deciding the next move. On the thread below, I'll provide what would be my approach for the coin through my technical chart analysis.

XPET VERY BULLISH SCENARIO
Hi friends.
An ADAM & EVE pattern formation at XPET .
Once the price breaks above the neckline level, it immediately rises to start a new bullish movement.
As we can see , the coin gain some volume , but it needs more to confirm this scenario.
Stay safe, use SL , DYOR , good luck !

Bitcoin eyeing $45.5K forming an adam's & Eve Bullish PatternBitcoin forming a bullish Adam & Eve pattern breakout with a golden cross over taking place on the 2H chart.

ARK ADAM AND EVE PATTERN: CURRENTLY ON A CRITICAL KEY LEVEL In this chart of BINANCE:ARKUSDT , the coin is forming an Adam and Eve pattern looking at the historical movements, the coin is in a downtrend, and the market is indicating a bullish reversal for ARK.
Currently, the coin is on consolidation around the pattern neckline area. It is a waiting game for the coin and in order for the pattern to materialize, we need to see a convincing confirmation of a breakout on the neckline on an hourly basis.
I'll provide updates on the comment thread for more detailed technical analysis.
Stay safe and happy trading!

FLOW ADAM AND EVE PATTERN: TIME FOR AN UPTRENDIn this logarithmic chart, BINANCE:FLOWUSDT is forming an Adam and Eve pattern in which the price movement creates two bottoms, one indication of reversal for the coin's current downtrend. Will it happen in the next days or may not? To answer that, I'll provide continuous technical analysis for you in this idea thread below. Always PLAN your trades, secure positions and happy trading!

An FOMC bull run could setup a giant Adam & Eve Pattern FOMC could lead to a strong bull run. This scenario would line up well with the Fed's schedule for rate hikes and cuts. The most bullish scenarios now have us with a 5% terminal rate by about April, then no rate cuts until late Q4 2023 to Q1 2024. This long plateau is typically when markets have peaked in the past, or upon the first cuts. As seen here:
s3.tradingview.com
Perhaps more important is when the yield curve turns up again. Once it gets above about +.3%, after inversion, the market tends to crash hard.
For more info on Adam & Eve patterns, check the pattern site. It's a wonderful resource.
thepatternsite.com
Targets would be long to ~450 SPY then short to ~240. It would make MMs a lot of money, so you shouldn't be surprised if it plays out like this.

BTCUSDT: Double top, Eve & Adam.This easy Adam & Eve Top can give traders a high profit short sale opportunity. The price usually don't draw a third high prior to entering a bear market.

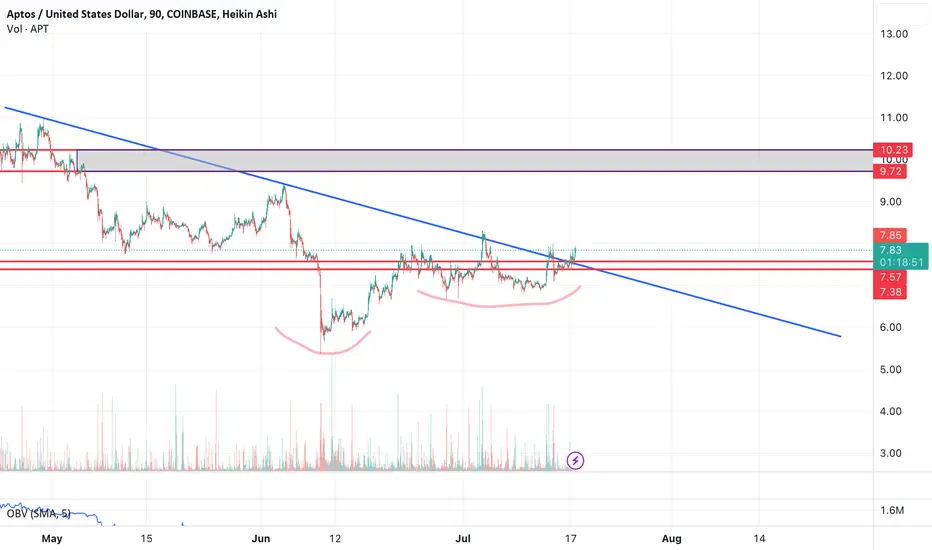
$APT short term bullish move?AMEX:APT looks interesting here. From the chart, you can see that APT has formed an adam and eve bottom and price has broke out of the trendline and is now sitting above it.
This is one of the few alts that hasn't moved yet and it looks to me like it's time.
I think over the coming days, we can potentially see a move of 20-30% into the grey box region on the chart.
Let's see if it happens.
📊 The Adam & Eve Chart pattern📍 What is the Adam and Eve Chart Pattern?
In essence, Adam and Eve is a variation of double top and double bottom patterns and is only slightly different from the traditional double bottoms/tops. The pattern is marked by the first bottom or top, the Adam, then the price moves up or down and creates another U-shaped where we can see Eve.
📍 Adam and Eve Double Bottom
Adam and Eve double bottoms are formed in a downtrend and create two bottoms before the price moves upward – the first bottom is a shape of a V (Adam) a peak at the support line while the second bottom is in a shape of a U (Eve). Simply put, the Adam and Eve chart patterns indicate a strong price level that is unlikely to be broken, and hence, a shift in market sentiment.
Trading with the Adam and Eve pattern is super simple. All you have to do is to identify the pattern correctly and know the proper levels of when and where to enter and exit a trade.
📍 Key Takeaways
The Adam and Eve pattern is a variation of the double top and bottom chart pattern that signals the start of a new trend.
The bullish version of the pattern features a V-shaped first bottom called Adam, followed by a U-shaped consolidation phase forming Eve. The same applies to the bearish version.
The breakout trading strategy is recommended for trading with the pattern. Enter a trade when the price breaks above the resistance line or below the support line, with a stop loss at the neckline level.
Volume plays a crucial role in the Adam and Eve pattern as it confirms buying or selling pressure, providing a strong signal for a trend reversal.
👤 @QuantVue
📅 Daily Ideas about market update, psychology & indicators
❤️ If you appreciate our work, please like, comment and follow ❤️

Hex about pump back to 0.195, stay tuned for higher projectionsBased upon the 30 min timeframe, I see a very nice looking adam and eve double bottom, not to mention hex is at the bottom of the zone, just added 500k hex to my stack....so easy
