ATGL: RSI improved significantly, good R:R Stock near a multi-tested support and witnessed a sharp move last week
the momentum indicator RSI indicates strength.
risk reward seems healthy for bulls with enough room for stock to inch higher
ADANIENT

ADANI Enterprises Ltd..... Seems to hv finally broken out.ADANI Enterprises Ltd..... Seems to hv finally broken out of the 38.2 % Fib Resistance, 2 days in a row (most likely). This is the third time its trying to break out of this zone. It's crossed the 50 ema & nearing the 200.
Needs to take out 2497, the recent high on a closing basis for a smoother ride up.
Am Bullish on the stock, one more reason being its subsidiary ' KUTCH COPPER ' which is to begin production full fledged very soon. Lets See.

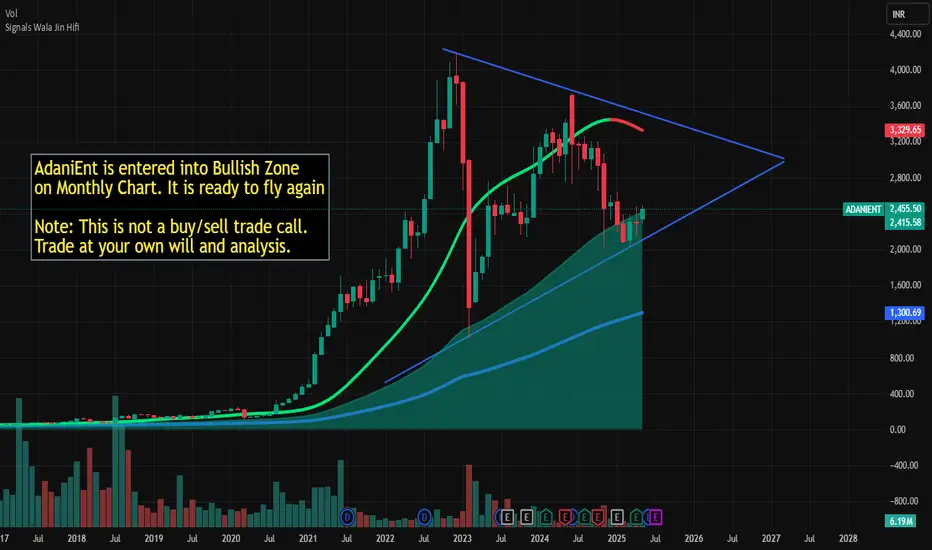
AdaniEnt is ready to fly againAdaniEnt is entered into Bullish Zone
on Monthly Chart. It is ready to fly again
Note: This is not a buy/sell trade call.
Trade at your own will and analysis.
113 rupe dropped Adanient after signal 113 rupees dropped #Adanient share after generation of Signal "Becho" means sell by my custom designed indicator named SignalsWalaJin
Note: This is not a buy sell trade call. Trade at your own will. Use stop loss too.

ADANIENT // What to do?www.tradingview.com
ADANIENT: Everyone should have a partner like ADANI...the GQG Partners :). Whenever Adani stocks are in trouble, they come as savior.
Jokes apart, here are the findings. The lower gaps are filled now.
The upper gaps are still open so there are chances it may go to fill them.
The Resistances are 2420 / 2544 / 2667 / 2755
The Support are 2020 / 1763 / 1500
I would prefer to enter for a buy position once it breaks and sustains above 2420 atleast and target will be 2750 for short term. The most safe or stable buy can be above 2900.

Can a Corporate Titan Withstand the Tremors of Allegations?In the high-stakes arena of global business, few narratives captivate the imagination quite like the meteoric rise and sudden turbulence of an economic powerhouse. The Adani Group once celebrated as a paragon of Indian entrepreneurial success, now finds itself navigating treacherous waters of legal scrutiny and market skepticism. What began as a remarkable journey of a diamond trader turned infrastructure magnate has transformed into a complex tale of ambition, power, and potential corporate misconduct that challenges our understanding of success in the modern economic landscape.
The allegations against Gautam Adani—ranging from securities fraud to a purported massive bribery scheme—represent more than just a corporate challenge; they symbolize a pivotal moment of reckoning for corporate governance in emerging markets. With U.S. prosecutors indicting Adani and a damaging report by Hindenburg Research accusing the group of "the largest con in corporate history," the conglomerate has witnessed a staggering $68 billion evaporation of market value. This precipitous fall from grace serves as a stark reminder that even the most seemingly invincible corporate empires can be vulnerable to the harsh light of forensic scrutiny and legal investigation.
The unfolding saga transcends the individual narrative of Gautam Adani, touching upon broader themes of economic development, political connections, and the delicate balance between entrepreneurial ambition and ethical conduct. As the Adani Group confronts these unprecedented challenges, the world watches with bated breath, understanding that the outcome will not merely determine the fate of one business empire, but potentially reshape perceptions of India's economic credibility on the global stage. The resilience, transparency, and response of the Adani Group in the face of these allegations will serve as a critical case study in corporate accountability and the complex interplay between business, politics, and regulatory oversight.
Ultimately, this narrative invites us to reflect on the fundamental principles of corporate integrity and the thin line between visionary entrepreneurship and potential systemic manipulation. As investors, policymakers, and global observers, we are compelled to ask: Can reputation, built over decades, withstand the seismic tremors of serious allegations? The Adani Group's journey offers a compelling, real-time exploration of this profound question, challenging our assumptions about success, power, and the intricate mechanisms that govern global business ecosystems.


ADANI ENTERPRIESEThis stock breakout major resistance level and TGT will be 20% upside
this is only for educational purpose only

#PODDARMENT 399 TGT 600 #NIFTY #BANKNIFTY #Stocktowatch #stocksNSE:PODDARMENT 399
TGT 600
SL 350
Timeframe < 6M
RR is good enough.
Factors: BULLISH WEDGE BREAKOUT Trend Following Rising Volume with rising Prices. Flag pattern breakout. Pennant Pattern Breakout with Bullish Candle. Retest Successful. Higher Highs & Higher Lows. Broken above RESISTANCE levels Trading at SUPPORT levels Earnings are strong. Bullish Wedge Breakout Risk Return Ratio is healthy. And Rising from Double Bottom Pattern to Flag Pattern forming. If you like my work KINDLY LIKE SHARE & FOLLOW this page for free Stock Recommendations. With 💚 from Rachit Sethia

BUY AROUND 1780 TGT 1950/2150 AVG @ 1680 SL BELOW 1540 The business model is growing at a very brisk pace and currently invested heavily in other sectors too looking a life time breakthrough for the stock and above mentioned target can be easily achieved with given stop loss

#ADANIENSOL 1176 Tgt 2500 #ADANIENT #ADANIPORTS #ATGL #AWL #ONGC#ADANIENSOL
NSE:ADANIENSOL
CMP 1176
TGT 2500
SL 900
TF < 9M
Great risk return trade off!
Factors: BULLISH WEDGE BREAKOUT Trend Following Rising Volume with rising Prices. Flag pattern breakout. Pennant Pattern Breakout with Bullish Candle. Retest Successful. Higher Highs & Higher Lows. Broken above RESISTANCE levels Trading at SUPPORT levels Earnings are strong. Bullish Wedge Breakout Risk Return Ratio is healthy. And Rising from Double Bottom Pattern to Flag Pattern forming. If you like my work KINDLY LIKE SHARE & FOLLOW this page for free Stock Recommendations. With 💚 from Rachit Sethia

#AWL 398 TGT 500 #Adaniports #adanient #adanipower #adaniensol#AWL
NSE:AWL
CMP 398
TGT 500
SL 350
TF < 6M
Great risk return trade off!
Factors: BULLISH WEDGE BREAKOUT Trend Following Rising Volume with rising Prices. Flag pattern breakout. Pennant Pattern Breakout with Bullish Candle. Retest Successful. Higher Highs & Higher Lows. Broken above RESISTANCE levels Trading at SUPPORT levels Earnings are strong. Bullish Wedge Breakout Risk Return Ratio is healthy. And Rising from Double Bottom Pattern to Flag Pattern forming. If you like my work KINDLY LIKE SHARE & FOLLOW this page for free Stock Recommendations. With 💚 from Rachit Sethia

#ATGL 1075 Tgt 3500 #ADANIENT #ADANIPORTS #ADANIENSOL #AWL #NSE#ATGL 1075 Tgt 3500
NSE:ATGL
CMP 1075
TGT 3500
SL 795
TF < 9M
Great risk return trade off!
Factors: BULLISH WEDGE BREAKOUT Trend Following Rising Volume with rising Prices. Flag pattern breakout. Pennant Pattern Breakout with Bullish Candle. Retest Successful. Higher Highs & Higher Lows. Broken above RESISTANCE levels Trading at SUPPORT levels Earnings are strong. Bullish Wedge Breakout Risk Return Ratio is healthy. And Rising from Double Bottom Pattern to Flag Pattern forming. If you like my work KINDLY LIKE SHARE & FOLLOW this page for free Stock Recommendations. With 💚 from Rachit Sethia

ADANIENT--@Trendline Retest??ADANIENT::
this stock is recently broken the trendline....
to confirm clear short side wait for the price to break the support and retest of the support.
on topside if price continues by breaking the resistance at 3280, it will reach next resistance at 3380, then look for sell here, find short opportunities in this stock...end of bullishness.

ADANIENT: Rocket Move Towards All-Time Highs?🚀📈Title: "ADANIENT: Anticipating a Rocket Move Towards All-Time Highs, Eyes Set on 6100 INR in the Next 4 Years! 🚀📈"
Description:
Embark on an exciting journey with ADANIENT as we anticipate a rocket move propelling the stock towards all-time highs. NEOALGO's analysis suggests a potential surge, with a bold outlook projecting a target of 6100 INR over the next four years. Our optimism stems from the formation of strong order blocks, indicating a robust upward trajectory.
This is our personal view, envisioning golden days ahead for Adani. The anticipation of a substantial upmove is underpinned by the promising order blocks, shaping a positive narrative.
Keep in mind, NEOALGO is not SEBI registered, and investors should conduct thorough research. Decisions made directly impact potential profit or loss.
Embrace the excitement, explore the potential of ADANIENT, and consider the optimistic future detailed in our analysis. 🌟📊 #ADANIENT #RocketMove #GoldenDaysAhead #OptimisticOutlook

#OSWALAGRO 33.40 Upside 17% recommended Buy - Rachit SethiaOSWALAGRO 33.40
TGT 39 +++
SL 30 --
RR ~ 2
Return 17% ++
TF < 6m
NSE:OSWALAGRO
Factors: BULLISH WEDGE BREAKOUT Trend Following Rising Volume with rising Prices. Flag pattern breakout. Pennant Pattern Breakout with Bullish Candle. Retest Successful. Higher Highs & Higher Lows. Broken above RESISTANCE levels Trading at SUPPORT levels Earnings are strong. Bullish Wedge Breakout Risk Return Ratio is healthy. And Rising from Double Bottom Pattern to Flag Pattern forming. If you like my work KINDLY LIKE SHARE & FOLLOW this page for free Stock Recommendations. With 💚 from Rachit Sethia

Adani Ent Levels for TomorrowThe yellow marked lines are important levels of Adani Ent for Tomorrow. One can use them as support and resistance levels.

Adani Enterprises is at major support.The most infamous stock in the Indian stock market in recent times- Adani Enterprises, has reached a very crucial support area and is probably attempting a bounce from here.
The chart is based on very simple concepts of Support/Resistance, Horizontal consolidation areas(HCR's) and trend lines. Nothing too complicated here, the entry too is pretty straight forward.
For a short term trade ,enter on trend line break confirmation and aim the HCR lower boundary for target.
The low at 2142 is crucial reversal point as of now and will act as a SL.
One important thing to note in this chart is the lack of volume confirmation for the past 2 months fall. What does a fall without volume confirmation mean? Is it bullish or bearish?
keep an eye on the stock and you will find for yourselves(:P).
CMP 2196
SL 2140
Target 1 - 2370
Target 2 - 2600

ADANIENT--@Trendline Break??this stock is trending downwards..
now the price is at support zone...
keep in short as long as price breaks this trendline...
if it failed to break the trendline it will continue its fall...
keep safe before short...
On bottom side we have a demand zone lies at 1900 levels...
look for buy ,if price comes back to the support.
on topside we have a strong resistance area at 2500...
if price breaks the this trendline and retest then chances are more to test the resistance again..

The Adani SagaAdani Enterprises (ADANIENT) has shown good recovery and has been in long consolidation since its last burst in May 2023 when Supreme Court granted SEBI Time for investigation.
It has taken a strong support at 2370 -2400 and today it has made a doji right at its support to suggest a reversal. While it is waiting for the next date in Supreme Court, there is an opportunity to enter at CMP as it offers a low risk opportunity.
Keeping 1 ATR as SL, it Is good to go long on Adani enterprises regardless of outside noise. Expecting a very big move soon coming out of a 4 month narrow consolidation phase after the Supreme Court hearing.
Not keeping any targets in this trade because this stock would move big and fast . I would prefer to keep moving my TSL up if my view turns out right.

ADANIENT--Breakout or Breakdown??I am sharing the important levels of Support and Resistance. These levels play a crucial role in trading decisions, as they act as reliable markers of price movements.
------>>Support levels are price points where an asset tends to find buying interest, preventing it from falling further.
---->Resistance levels, on the other hand, are points where selling pressure typically prevents the asset from rising higher.
If price breaks the resistance, we have a chance of filling the bearish gap, soo keep in buyside until it touches the zone of resistance and bearish gap.
Take a look at these levels and trade accordingly. Recognizing and respecting these support and resistance levels can help traders make informed decisions and manage risk effectively. They serve as key reference points for technical analysis and are vital tools in successful trading strategies.
Trade safe...Thank you guys for your support

ADANIENT ViewsThere can be a range bound long trade in the script as it is reacting around the value area.
It will be exciting to add this script in watch list for study purposes.

ADANIENT--@ Trendline??A strong fall is detected, continuously from last few sessions...
Now it is near to its trendline...and a strong rise is observed previously...
if price breaks and retest look for sell...
we have a strong rally base rally is observed at 2330-2280 levels may push the price upwards..
keep look at these levels...
