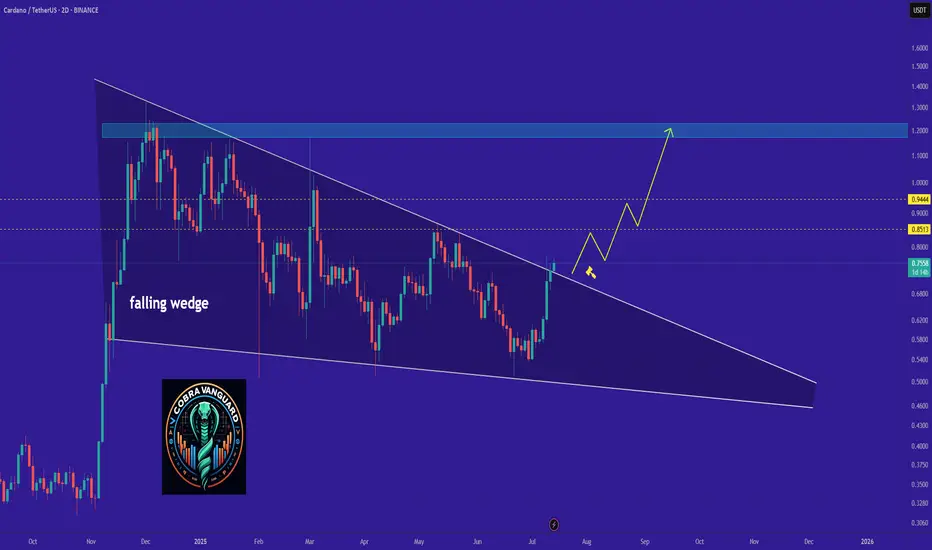
ADA - Time to buy again!The price has broken the wedge pattern, which means it can easily reach its previous high or even go higher.
Best regards CobraVanguard.💚
Adausd
DeGRAM | ADAUSD above the demand zone📊 Technical Analysis
● ADA is testing the confluence of the long-term support line and the 0.54-0.63 demand zone; every prior touch of this area sparked a 20-30 % rebound.
● A falling wedge within the broader descending channel is close to completion; a 16 h close above the wedge roof (~0.66) activates a measured move to the first horizontal resistance at 0.73 and the channel cap near 0.86.
💡 Fundamental Analysis
● The upcoming Chang hard-fork, which introduces on-chain governance and boosts staking utility, is scheduled for main-net in Q3 2025, lifting on-chain activity and TVL.
✨ Summary
Long 0.58-0.63; wedge breakout >0.66 targets 0.73 ➜ 0.86. Bull bias void on a 16 h close below 0.54.
-------------------
Share your opinion in the comments and support the idea with a like. Thanks for your support

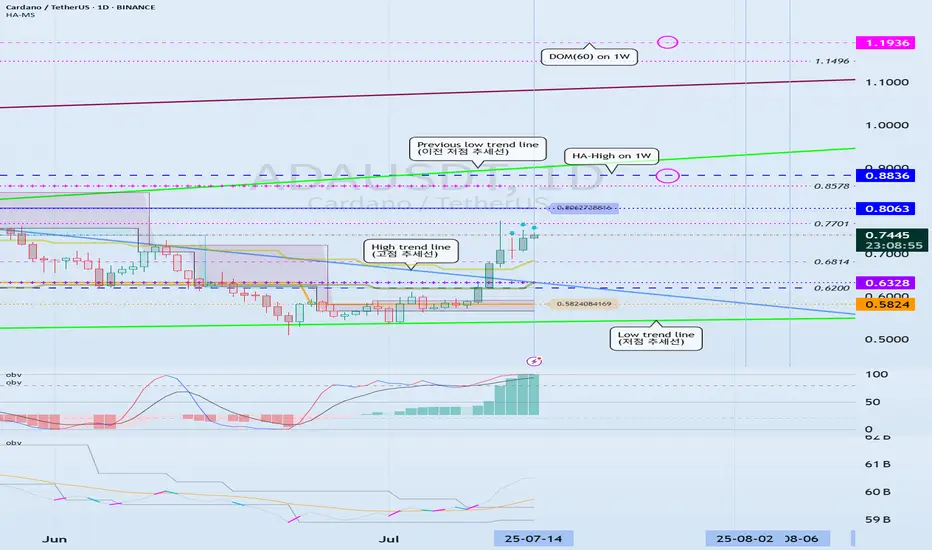
Can we break above the 0.8063-0.8836 range?
Hello, traders.
If you "Follow", you can always get the latest information quickly.
Have a nice day today.
-------------------------------------
(ADAEUSDT 1D chart)
ADA is forming a long-term rising channel and is showing an upward trend as it breaks above the mid-term high downtrend line.
We need to see if it can rise above 0.8836 and maintain the price to rise above the previous mid-term low trend line.
-
The DOM(60) indicator is showing signs of being newly created.
Accordingly, we need to see where the DOM(60) indicator is formed.
Since the HA-High indicator is formed at 0.8063, in order to continue the upward trend, it must rise at least above 0.8063 to maintain the price.
Accordingly, the key is whether the price can be maintained above 0.6328.
-
It is possible to show a mid- to long-term upward trend only if it breaks through the HA-High ~ DOM(60) section of the 1W chart upward.
Therefore, the 0.8836-1.1936 section is likely to be the resistance section.
-
Based on the current price position, the support section is the 0.5824-0.6328 section.
However, since the positions of the HA-Low indicator and the DOM(-60) indicator are switched, if it shows a downward trend, there is a possibility that a new HA-Low indicator will be created.
If a new HA-Low indicator is created, it is important to determine whether there is support near it.
-
Thank you for reading to the end.
I hope you have a successful trade.
--------------------------------------------------
- Here is an explanation of the big picture.
(3-year bull market, 1-year bear market pattern)
I will explain the details again when the bear market starts.
------------------------------------------------------
ADA/USD Thief Trading Plan – Bullish Snatch & Run!🚨 ADA/USD HEIST ALERT! 🚨 – Bullish Loot Grab Before the Escape! (Thief Trading Strategy)
🌟 Greetings, Market Pirates & Profit Raiders! 🌟
🔥 THIEF TRADING STRIKES AGAIN! 🔥
💎 The Setup:
Based on our stealthy technical & fundamental heist tactics, ADA/USD is primed for a bullish loot grab! The plan? Long entry with an escape near key resistance. High-risk? Yes. Overbought? Maybe. But the heist must go on!
🎯 Key Levels:
📈 Entry (Vault Cracked!) → Swipe bullish positions on pullbacks (15m-30m precision).
🛑 Stop Loss (Escape Route) → Recent swing low (4H basis) at 0.5290 (adjust per risk!).
🏴☠️ Target (Profit Snatch!) → 0.6500 (or bail early if bears ambush!).
⚡ Scalpers’ Quick Heist:
Only scalp LONG!
Big wallets? Charge in! Small stacks? Ride the swing!
🔐 Lock profits with Trailing SL!
📢 Breaking News (Heist Intel!):
Fundamentals, COT, On-Chain, Sentiment— All hint at bullish momentum!.
🚨 ALERT! News volatility ahead—Avoid new trades during releases! Secure running positions with Trailing SL!
💥 BOOST THIS HEIST! 💥
👉 Hit LIKE & FOLLOW to fuel our next market robbery! 🚀💰
🎯 Profit taken? Treat yourself—you earned it!
🔜 Next heist incoming… Stay tuned, pirates! 🏴☠️💎

🐋 Deep Dive Part II: Whale Behavior & Market Mastery! 🌊📚Hey Crypto Enthusiasts! 🚀
In a recent analysis, I not only nailed Bitcoin's (BTC) movement but also illuminated the subsequent altcoin surge, driven by insightful whale behavior observations. Let's merge these insights with a focus on ADA (Cardano), OP (Optimism), SOL (Solana), and BTC. 📊
Cardano's (ADA) Meteoric Rise 🌟
ADA's journey began with a break above a pivotal support-resistance level. My entry point at 0.256 turned into a remarkable rally, hitting 52 cents. This movement was a classic case of altcoin buoyancy following Bitcoin's pause.
Optimism (OP) and the Altcoin Breakouts 🌈
In the shadow of Bitcoin's stagnation, altcoins like OP exhibited significant breakouts, showcasing the shifting focus of market whales from Bitcoin to promising altcoins.
Bitcoin (BTC) and Whale Dynamics 📉
Bitcoin's behavior provided a crystal ball into the whale activities. As BTC approached a major resistance level, it signaled a strategic move by whales to divert funds towards altcoins, catalyzing their surge.
Solana (SOL) and Market Trends ☀️
Solana's chart also mirrored this trend, highlighting the broader market dynamics influenced by these significant players.
🔍 Insight on Whale Behavior:
My analysis delved deep into the whale behavior, highlighting how Bitcoin's rally and subsequent pause was a precursor to altcoin dominance. This strategic pause in Bitcoin's ascent was a clear signal for the whales to redistribute their focus and capital, sparking a remarkable rise in altcoins like ADA, OP, and SOL. 🔄
The Bigger Picture - Understanding Market Shifts: What this trend teaches us is the importance of reading between the lines. Whale movements often precede major market shifts, and by understanding these patterns, we position ourselves to make informed decisions. 🧠
Future Outlook: As we continue to monitor these market dynamics, it's crucial to stay vigilant. The crypto market is known for its volatility, and while the current trend favors altcoins, it's essential to be prepared for any shifts that may arise. Always keep an eye on key resistance and support levels, market sentiment, and global economic factors that could influence the next big move. 🌐
Together, let's stay ahead of the curve in this fascinating and ever-evolving world of cryptocurrency. Your insights and engagement are what make this journey exciting and rewarding!
One Love,
The FXPROFESSOR 💙
part 1:

Cardano Forming Potential Reversal Structure Inside TriangleHello guys!
Cardano’s been stuck inside this big descending triangle for months. We had a fake breakout a while back that totally failed.
Now, price is back at support and showing bullish divergence. That’s usually a sign sellers are getting tired.
If buyers step in here, I’m expecting a move back up toward 0.67–0.70 (top of the triangle). But if it loses the 0.53 support, that setup’s off the table.
Bias: Leaning bullish
🎯 Target: 0.67–0.70
Invalidation: Clean break below 0.53
Let’s see how this plays out.

Could Cardano become a crypto unicorn?And make a 3rd new all time high in subsequent cycles.
One fib extension certainly suggests that is possible pointing towards around $4.80
Let's see ... things can mover very fast during altseason.

Cardano: Eyeing Alternative Rally ScenarioCardano’s ADA token has realized further gains. As a result, we’ve increased the probability of our alternative scenario—in which the low of the wave (ii) correction is already in place—to 40%. For ADA to take this “shortcut,” the next step would be to break above resistance at $0.86, followed by a move past the $1.32 level. For now, however, we’re maintaining our primary outlook and are preparing for a new low in blue wave (ii). In this scenario, the price should hold above support at $0.31.
📈 Over 190 precise analyses, clear entry points, and defined Target Zones - that's what we do.

ADA/USDT Ready to Explode? Watch This Symmetrical Triangle
🧠 Detailed Technical Analysis:
Cardano (ADA) is currently consolidating within a well-defined Symmetrical Triangle pattern on the 3-day chart. This pattern is formed by a series of lower highs and higher lows, indicating compression and indecision in the market — a classic setup for a strong breakout in either direction.
Price has recently bounced off the lower boundary of the triangle and is now heading toward the resistance trendline. A breakout from this structure could trigger a powerful bullish move if confirmed with volume.
🔼 Bullish Scenario (Upside Breakout):
A confirmed breakout above the descending trendline (~$0.65) with strong volume would indicate buyers regaining control.
Key upside targets based on historical resistance zones and the triangle's height:
🟡 $0.8144 – First major horizontal resistance
🟡 $0.9386 – Mid-range resistance from March 2025
🟡 $1.0920 – Former distribution zone
🟡 $1.2118 – Medium-term bullish target
🔵 $1.3264 – Key structural high from previous cycle
🔔 A breakout from a symmetrical triangle often leads to significant price action due to the long period of coiled pressure release.
🔽 Bearish Scenario (Breakdown):
If ADA fails to break above $0.62–$0.65 and gets rejected from the upper boundary of the triangle, the price could:
Revisit the lower trendline support around $0.55
A breakdown below this zone could lead to:
🔻 $0.48
🔻 $0.39
🔻 $0.2756 – A major psychological and historical support level
⚠️ This scenario would invalidate the bullish structure and potentially resume the mid-term downtrend.
📐 Pattern Breakdown – Symmetrical Triangle:
Pattern Duration: ~6 months of consolidation (Feb – July 2025)
Support Zone: $0.55 – $0.60
Resistance Zone: $0.65 – $0.75
Breakout Confirmation: Requires strong bullish candle close with increased volume
Volume Profile: Decreasing, typical of symmetrical triangle before explosive move
💡 Final Thoughts:
Cardano is at a make-or-break point. It has bounced from support and is attempting a breakout from this symmetrical triangle. If successful, this could mark the beginning of a major trend reversal with over +100% upside potential from current levels.
On the flip side, failure to break resistance could lead to a deeper retracement. That’s why confirmation is critical before entering a position!
#ADAUSDT #CardanoAnalysis #CryptoBreakout #SymmetricalTriangle #AltcoinSeason #BullishBreakout #BearishScenario #TechnicalAnalysis #CryptoChart #CryptoTrading #Altcoins

HolderStat┆ADAUSD rising topBINANCE:ADAUSDT is breaking out of a falling channel, following a long consolidation period and bullish wedge development. Price action is coiling around 0.58–0.60 and may rally toward 0.65 if the breakout sustains. Historical patterns suggest continued strength from this structure.

ada usdt scalp tradeshort term pullback expected from ada, cardano so take it with small amount, trade entry based on 5m, so don't expect bigger targets. must use sl.

HolderStat┆ADAUSD retesting the support levelBINANCE:ADAUSDT is attempting to reverse from the lower bound of a descending wedge, echoing a previous breakout structure from May. With a bounce forming near 0.54 and price climbing inside a narrowing wedge, a move toward 0.70 could materialize if volume supports the push.

ADAUSD Is this 1W Golden Cross what the market needs??Cardano (ADAUSD) just formed a 1W Golden Cross this week, the first in its history, amidst a continuous bearish sequence since the December 02 2024 High. With its 1W RSI just below neutrality, this simply highlights the undervalued condition of this token relative not only to the rest of the high cap market, but also to its previous Bull Cycle.
As you can see, based both on 1W RSI and price action terms, we may be in a consolidation phase similar to September - November 2020, at the end of a Megaphone pattern. That pattern was the Accumulation vessel of the Cycle that led to the massive 2021 parabolic rally and the eventual Cycle Top / Higher High of the historic Channel Up.
According to that, we should be expecting a 1.236 Fibonacci extension test, targeting $5.000.
-------------------------------------------------------------------------------
** Please LIKE 👍, FOLLOW ✅, SHARE 🙌 and COMMENT ✍ if you enjoy this idea! Also share your ideas and charts in the comments section below! This is best way to keep it relevant, support us, keep the content here free and allow the idea to reach as many people as possible. **
-------------------------------------------------------------------------------
💸💸💸💸💸💸
👇 👇 👇 👇 👇 👇

HolderStat┆ADAUSD formed rising bottomBINANCE:ADAUSDT has formed a symmetrical triangle after finding firm support around 0.54. Previous consolidation zones have led to significant breakouts, and the current structure is showing early signs of a similar rally. If bulls manage to reclaim 0.58, a climb toward 0.66 and 0.70 becomes likely, with upper trendline resistance acting as a magnet for price.

It's disappointing !!!Do you think this will happen, or do you see ADA below $0.50 in the future?
Best regards CobraVanguard.💚

HolderStat┆ADAUSD retest of the supportBINANCE:ADAUSDT has bounced from the 0.55 support level, completing a falling wedge structure. The price now attempts to recover, with a visible bullish wave formation targeting the 0.62 resistance trendline. Multiple past consolidations have preceded breakouts, and if this pattern holds, a strong upside push is possible. Watch for confirmation of continued higher lows.

ADA | BTC | ET | Why ALTSEASON is COMING SOONAfter a -34% retracement, ADA is ready to go higher alongside with the rest of the alt market.
We see a very interesting phenomena here, were ADA also represents a large part of the larger alts: BTC pulls back, ETH is starting to increase or trades sideways (before the increase) whilst the alts dip.
This is actually BULLISH for alts, showing the very clear rotation between BTC, ETH and top 15 alts.
If we look at the macro of ANY of the alts I've been working through recently, a similar pattern appears - a clear bottom, followed by a sideways trade. This is usually the point just before the big ALTS season.
We actually see this pattern at the end of the 2018 rally, as well as after the 202- Covid dip:
The bottom line -
ADA and other alts are gearing up for their ALTSEASON. With patience, we will soon see some great gains across the markets.

Cardano- Polkadot, Cardano, or any other major cryptocurrencies all feel alike.
- Only the price is different.
- Find Resistance.
- Find Support.
- Master your emotions, learn and gamble at the good time.
Happy Tr4Ding !

Cardano UpdateA lot of you have been DMing me asking for altcoin analysis. i hear you, but here's the truth:
- Right now, most altcoins are simply too weak to offer a reliable forecast. I prefer to post when timing makes sense, not just for engagement, but to avoid misleading anyone.
- BTC Dominance is still heavily suppressing the altcoin market, and I’d rather wait than risk rekting my followers with premature calls.
So why do I post about Cardano? :
- Simple, Cardano is one of the most established altcoins. It makes sense to track its evolution alongside Bitcoin and Ethereum. When you're analyzing the broader market cycle, starting with BTC, ETH, and ADA gives meaningful context. Newer cryptocurrencies from 2020+ don’t have the same historical data, which makes reliable analysis much harder.
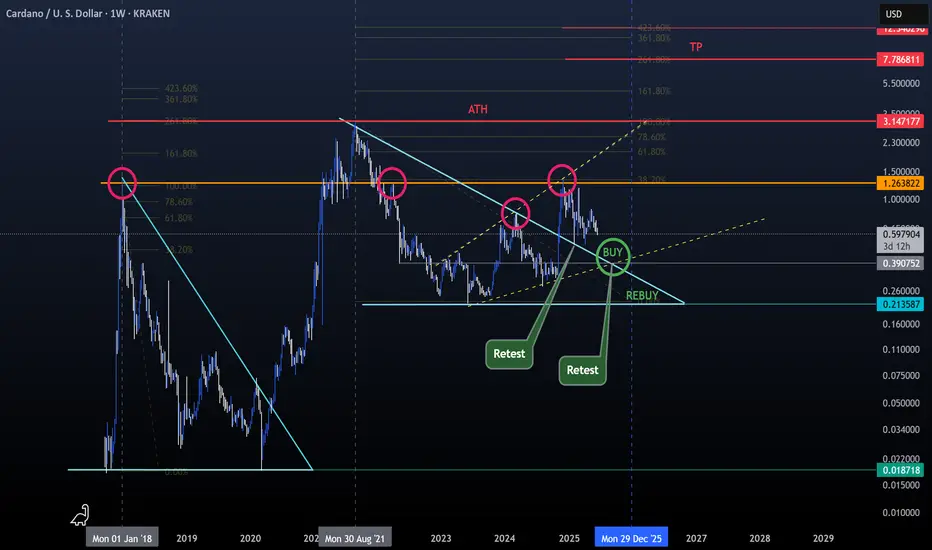
Back to Trading (Everything is marked on the chart for easier reading) :
- Cardano got rejected around $1.25, which aligns with its 2018 ATH, a key historical resistance.
- Check the bullish megaphone pattern and how it connects with the trendline and that $1.25 level (marked with yellow dotted lines).
- Also observe the minor bounces and retests above the bearish triangle trendline (light blue).
What we can do now?
- Nothing. If BTC dips, altcoins will likely follow and get rekt.
Best strategy for now:
- Consider setting a buy order around $0.41 (don’t go all in).
- Keep some dry powder in case of further downside, potentially to rebuy around $0.21 if pressure continues.
Be wise, be patient, ride the wave, don’t fight it.
Happy Tr4Ding !
HolderStat┆ADAUSD retesting of the $0.6 levelBINANCE:ADAUSDT is orbiting the major $0.6000 shelf inside a fading down-channel. A lift through 0.63-0.64 would flip short-term momentum and open a swift path toward the mid-$0.70s, while a daily close below $0.58 cancels the run-up thesis 📈

#ADA/USDT#ADA
The price is moving within a descending channel on the 1-hour frame and is expected to break and continue upward.
We have a trend to stabilize above the 100 moving average once again.
We have a downtrend on the RSI indicator that supports the upward move with a breakout.
We have a support area at the lower limit of the channel at 0.6300, acting as strong support from which the price can rebound.
Entry price: 0.6360
First target: 0.6460
Second target: 0.6580
Third target: 0.6700

HolderStat┆ADAUSD BULLISH BOUNCEBYBIT:ADAUSDT is squeezing out of its falling-channel floor, carving a clean higher-low right above 0.66. That move flips a month-long consolidation into a fresh trend-restart signal. A steady bid on top of the diagonal keeps the bias pointing north-east; reclaiming 0.71 unlocks the 0.77 target where the upper megaphone meets prior supply. Break that and the “new-highs” narrative returns to center stage.

HolderStat┆ADAUSD above the $0.66 levelCRYPTOCAP:ADA
→ Climbs out of falling channel, presses 0.68 trend-lid
↳ Accept > 0.68 targets 0.72–0.75 → 0.80–0.85
⇢ Must defend 0.60–0.63 breakout shelf
⤴ Fall < 0.60 hands reins to bears aiming 0.58–0.55
